File - Learning with Brooke
advertisement
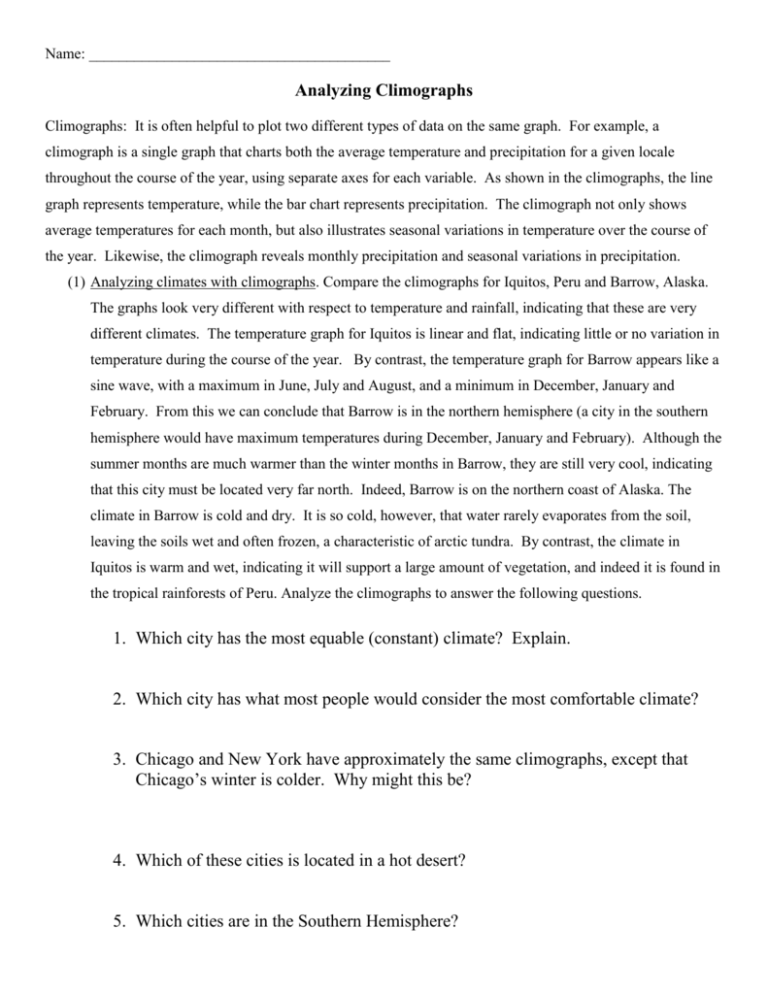
Name: ________________________________________ Analyzing Climographs Climographs: It is often helpful to plot two different types of data on the same graph. For example, a climograph is a single graph that charts both the average temperature and precipitation for a given locale throughout the course of the year, using separate axes for each variable. As shown in the climographs, the line graph represents temperature, while the bar chart represents precipitation. The climograph not only shows average temperatures for each month, but also illustrates seasonal variations in temperature over the course of the year. Likewise, the climograph reveals monthly precipitation and seasonal variations in precipitation. (1) Analyzing climates with climographs. Compare the climographs for Iquitos, Peru and Barrow, Alaska. The graphs look very different with respect to temperature and rainfall, indicating that these are very different climates. The temperature graph for Iquitos is linear and flat, indicating little or no variation in temperature during the course of the year. By contrast, the temperature graph for Barrow appears like a sine wave, with a maximum in June, July and August, and a minimum in December, January and February. From this we can conclude that Barrow is in the northern hemisphere (a city in the southern hemisphere would have maximum temperatures during December, January and February). Although the summer months are much warmer than the winter months in Barrow, they are still very cool, indicating that this city must be located very far north. Indeed, Barrow is on the northern coast of Alaska. The climate in Barrow is cold and dry. It is so cold, however, that water rarely evaporates from the soil, leaving the soils wet and often frozen, a characteristic of arctic tundra. By contrast, the climate in Iquitos is warm and wet, indicating it will support a large amount of vegetation, and indeed it is found in the tropical rainforests of Peru. Analyze the climographs to answer the following questions. 1. Which city has the most equable (constant) climate? Explain. 2. Which city has what most people would consider the most comfortable climate? 3. Chicago and New York have approximately the same climographs, except that Chicago’s winter is colder. Why might this be? 4. Which of these cities is located in a hot desert? 5. Which cities are in the Southern Hemisphere? 6. Which of these cities is located in tropical rainforest? 7. Which of two of these cities have a Mediterranean climate, characterized by mild winters and warm, dry summers? 8. Which city would experience monsoon type rains (heavy, summer rains)? 9. Which city has the coldest, driest summers? 10. Which of the following cities has the most annual rainfall, Chicago, New York, Dallas or Miami? 11.Which of the following has more summer rainfall, Denver, Los Angeles, or Seattle? 12.Which city has a climate most similar to Chicago? 13.Which of the following cities would be best suited for outdoor ice skating rinks, Chicago, New York, Dallas or Miami? 14.Which has more winter rainfall, Mangalore, India or Seattle, Washington? 15.Which city has two “wet” seasons? Climograph for Barrow, AK Climograph for Iquitos, Peru 350 350 30 30 300 300 20 20 0 150 150 0 100 -10 -20 100 -10 50 -20 50 -30 0 0 -30 J F MA MJ J A S O N D J F MA M J J A S O N D Climograph for Chicago, Illinois Climograph for Tindouf, Algeria 350 350 30 30 300 300 20 20 10 200 0 150 100 -10 100 -10 50 -20 50 -20 -30 0 0 J F M A M J J A S O N D -30 J F MA M J J A S O N D )temperature (C 0 150 )temperature (C 10 200 precipitation (mm) 250 250 precipitation (mm) 10 200 )temperature (C 10 200 precipitation (mm) 250 )temperature (C precipitation (mm) 250 Climograph for Perth, Australia Climograph for Los Angeles, CA 350 350 30 30 300 300 20 20 10 200 0 150 100 -10 100 -10 50 -20 50 -20 -30 0 0 -30 J F MA M J J A S O N D J F MA M J J A S O N D Climograph for Denver, CO Climograph for NewYork, NY 350 350 30 30 300 300 20 20 0 100 -10 50 0 J F MA MJ J A S O N D precipitation (mm) 150 )temperature (C 10 200 10 200 0 150 100 -10 -20 50 -20 -30 0 -30 J F MA MJ J A S O N D )temperature (C 250 250 precipitation (mm) )temperature (C 0 150 )temperature (C precipitation (mm) 10 200 precipitation (mm) 250 250 Climograph for Seattle, WA Climograph for Miami, FL 350 350 30 30 300 300 20 20 10 200 0 150 0 100 -10 100 -10 50 -20 50 -20 0 -30 0 -30 150 J F MA MJ J A S O N D J F M A M J J A S O N D Climograph for Dallas, TX Climograph for Mangalore, India 350 350 30 30 300 300 20 20 250 150 0 100 -10 50 0 J F MA MJ J A S O N D 10 200 150 0 100 -10 -20 50 -20 -30 0 -30 J F M A M J J A S O N D )temperature (C 10 200 precipitation (mm) 250 )temperature (C precipitation (mm) )temperature (C 10 200 )temperature (C precipitation (mm) 250 precipitation (mm) 250
