Finding the Optimal Salt Concentration For
advertisement
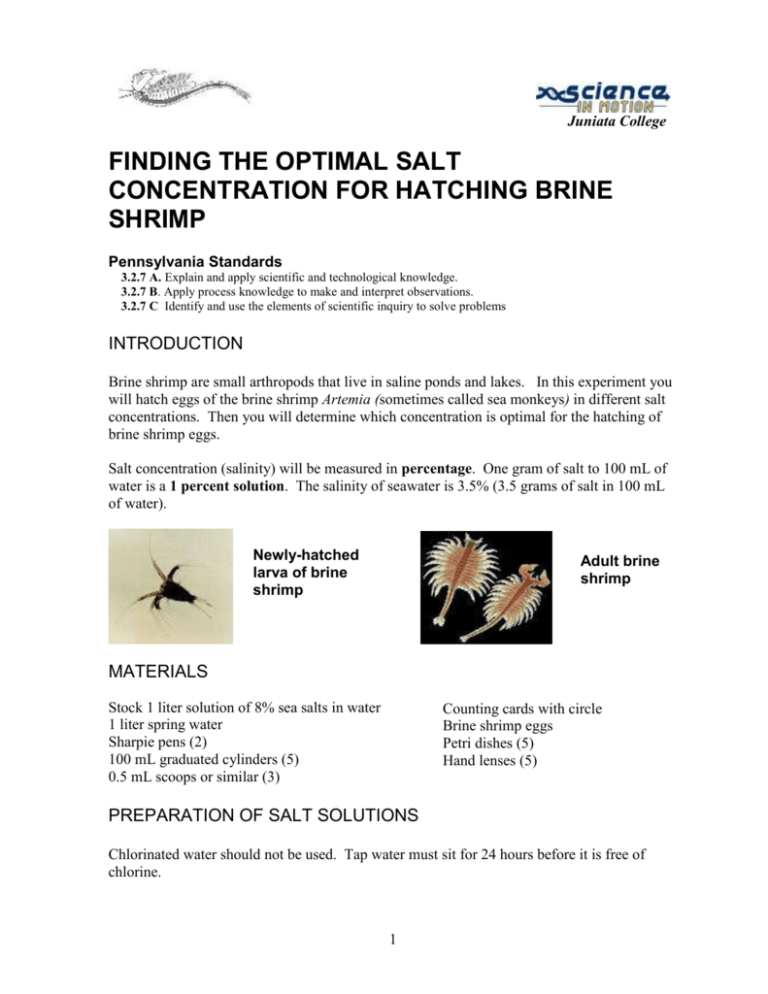
Juniata College FINDING THE OPTIMAL SALT CONCENTRATION FOR HATCHING BRINE SHRIMP Pennsylvania Standards 3.2.7 A. Explain and apply scientific and technological knowledge. 3.2.7 B. Apply process knowledge to make and interpret observations. 3.2.7 C Identify and use the elements of scientific inquiry to solve problems INTRODUCTION Brine shrimp are small arthropods that live in saline ponds and lakes. In this experiment you will hatch eggs of the brine shrimp Artemia (sometimes called sea monkeys) in different salt concentrations. Then you will determine which concentration is optimal for the hatching of brine shrimp eggs. Salt concentration (salinity) will be measured in percentage. One gram of salt to 100 mL of water is a 1 percent solution. The salinity of seawater is 3.5% (3.5 grams of salt in 100 mL of water). Newly-hatched larva of brine shrimp Adult brine shrimp MATERIALS Stock 1 liter solution of 8% sea salts in water 1 liter spring water Sharpie pens (2) 100 mL graduated cylinders (5) 0.5 mL scoops or similar (3) Counting cards with circle Brine shrimp eggs Petri dishes (5) Hand lenses (5) PREPARATION OF SALT SOLUTIONS Chlorinated water should not be used. Tap water must sit for 24 hours before it is free of chlorine. 1 Each of five teams prepares one of the dilutions of the 8 percent sea salt solution using the table below. Stock 8% solution Water 100 mL 0 mL = 8% 75 mL 25 mL = 6% 50 mL 50 mL = 4% 25 mL 75 mL = 2% 100 mL = 0% 0 Final concentration PROCEDURE 1. With a sharpie pen each team labels a Petri dish with its salt concentration (0 %, 2 %, 4 %, 6 %, or 8 %). . 2. Next, the team measures 25 mL of its solution in a graduated cylinder and pours the solution into the bottom of its Petri dish. 4. Using the small scoop, place abour a 1/4 scoopful of brine shrimp eggs in the Petri dish. Stir gently and replace the top of the dish to prevent evaporation. Now all the dishes will be put where they won't be disturbed. Call this day 0. 5. On day 2 place a file card under the Petri dish and position the dish exactly over the circle. Do this under good lighting. 7. With a hand lens count the number of brine shrimp in one quadrat of the dish. Note: if the shrimp are not numerous the teacher may have all teams count more than one quadrant. Count dead brine shrimp also, but do not count egg cysts. Record the number in the DATA TABLE. . 2 NAME_________________ WORKSHEET DATE_________________ SECTION______________ DATA TABLE Dish Percent Salt Number of Concentration Hatched Shrimp 1 0% 2 2% 3 4% 4 6% 5 8% 1. Record your team's number of brine shrimp and the number for the other four teams. 2. Based on the results in the Data Table, what is the optimal salt concentration for hatching brine shrimp? Optimal concentration = ______percent. GRAPHING YOUR DATA The numbers in the Data Table can be converted into a graph. . The x-axis (horizontal) shows the five salt concentrations used in the experiment. The y-axis (vertical) indicates the number of brine shrimp that hatched in each of the five salt concentrations. This number is the unknown variable of the experiment. The experimental variable is always plotted on the y-axis. 3 To make a bar graph of the brine shrimp data, place a pencil mark at the top of a salt concentration column at the number of brine shrimp recorded for that column. For example, if 20 brine shrimp were counted in the 0% dish, the bar for the 0% column would rise to the 20 shrimp mark. 3 .Draw a bar for each of the five salt concentrations. Lightly shade the bars with pencil or pen to make them stand out. Note how the relation of brine shrimp number to salt concentration is easier to visualize in a graph than in a data list. 4..Which habitat would have the highest hatching rate for these brine shrimp? a. The Juniata River b. The Pacific Ocean (3.5% salinity) c. The Great Salt Lake in Utah (average 8%). d. The Dead Sea in Palestine (30%). Explain the reasons for your answer. To answer questions, scientists do experiments like this one when they can. Some . variable is unknown (in this case optimum salinity for hatching). Several setups are run, each with a different level of a known control (0, 2, 4, 6, 8% salinity). In a successful experiment, the change of the unknown variable (bigger, smaller, higher, lower, etc.) at different levels of the known control is revealed. This is how the scientific method works. 4 Templates for counting cards 5
