FINAL EXAM
advertisement
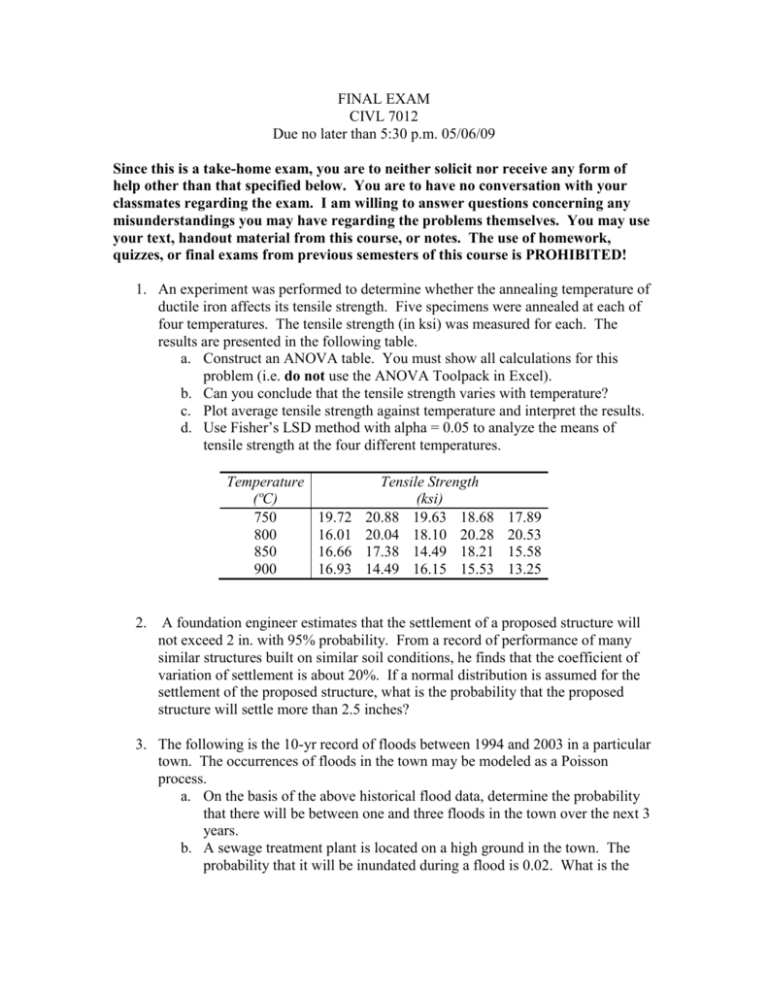
FINAL EXAM CIVL 7012 Due no later than 5:30 p.m. 05/06/09 Since this is a take-home exam, you are to neither solicit nor receive any form of help other than that specified below. You are to have no conversation with your classmates regarding the exam. I am willing to answer questions concerning any misunderstandings you may have regarding the problems themselves. You may use your text, handout material from this course, or notes. The use of homework, quizzes, or final exams from previous semesters of this course is PROHIBITED! 1. An experiment was performed to determine whether the annealing temperature of ductile iron affects its tensile strength. Five specimens were annealed at each of four temperatures. The tensile strength (in ksi) was measured for each. The results are presented in the following table. a. Construct an ANOVA table. You must show all calculations for this problem (i.e. do not use the ANOVA Toolpack in Excel). b. Can you conclude that the tensile strength varies with temperature? c. Plot average tensile strength against temperature and interpret the results. d. Use Fisher’s LSD method with alpha = 0.05 to analyze the means of tensile strength at the four different temperatures. Temperature (ºC) 750 800 850 900 2. 19.72 16.01 16.66 16.93 Tensile Strength (ksi) 20.88 19.63 18.68 20.04 18.10 20.28 17.38 14.49 18.21 14.49 16.15 15.53 17.89 20.53 15.58 13.25 A foundation engineer estimates that the settlement of a proposed structure will not exceed 2 in. with 95% probability. From a record of performance of many similar structures built on similar soil conditions, he finds that the coefficient of variation of settlement is about 20%. If a normal distribution is assumed for the settlement of the proposed structure, what is the probability that the proposed structure will settle more than 2.5 inches? 3. The following is the 10-yr record of floods between 1994 and 2003 in a particular town. The occurrences of floods in the town may be modeled as a Poisson process. a. On the basis of the above historical flood data, determine the probability that there will be between one and three floods in the town over the next 3 years. b. A sewage treatment plant is located on a high ground in the town. The probability that it will be inundated during a flood is 0.02. What is the probability that the treatment plant will not be inundated for a period of 5 years? Year 1994 1995 1996 1997 1998 Number of Floods 1 0 1 1 0 Year 1999 2000 2001 2002 2003 Number of Floods 0 2 0 0 1 4. A self-standing antenna disk is supported by a lattice structure that is anchored to the ground at the base. During a wind storm, the disk may be damaged as a result of anchorage failure and/or failure of the lattice structure. Suppose the following information is known: I. The probability of anchorage failure during a wind storm is 0.006 II. If the anchorage should fail, the probability of failure of the lattice structures will be 0.40, whereas the probability of failure of the anchorage given that failure has occurred in the lattice structure is 0.30. Determine the following: a. The probability of damage to the antenna disk during a wind storm. b. The probability that only one of the two potential failure modes will occur during a wind storm. c. If the disk is damaged during a wind storm, what is the probability that it was caused only by anchorage failure? 5. The data in the table below are radium-226 levels (measured in pCi/L) for 12 soil specimens collected in southern Dade County, Fl. Utilize the nonparametric sign test to determine whether the median radium-226 level in the soil in southern Dade County exceeds the Environmental Protection Agency limit of 4.0 pCi/L, using α= 0.10. 1.46 1.30 5.92 0.58 8.24 1.86 4.31 3.51 1.41 1.02 6.87 1.70 6. The following are data on the breaking strength (in pounds) of 2 kinds of material. Use the Wilcoxon Rank-Sum test at the 0.05 level of significance to test the claim that the strength of Material 1 is stochastically larger than the strength of Material 2. Material 1 Material 2 144 175 181 164 200 172 187 194 169 176 171 198 186 154 194 134 7. The article “Multiple Linear Regression for Lake Ice and Lake Temperature Characteristics” (S. Gao and H. Stefan, Journal of Cold Regions Engineering, 1999:59-57) presents data on maximum ice thickness in mm (y), average number of days per year of ice cover(x1), average number of days the bottom temperature is lower than 8 degrees C (x2), and the average snow depth in mm (x3) for 13 lakes in Minnesota. The data are presented in the following table. a. Fit a multiple regression model to the data below (using all three x variables). b. Test for significance of regression. c. Test the hypothesis that β3 = 0. d. Construct a 95% confidence interval for β2. e. Build an appropriate regression model using backward elimination. f. If two lakes differ by 2 in the average number of days per year of ice cover, with other variables being equal, by how much would you expect their maximum ice thicknesses to differ? Y 730 760 850 840 720 730 840 730 650 850 740 820 710 x1 152 173 166 161 152 153 166 157 136 142 151 145 147 x2 198 201 202 202 198 205 204 204 172 218 207 209 190 x3 91 81 69 72 91 91 70 90 47 59 88 60 63 8. The ratio of observed to calculated settlements for piles is a measure of the accuracy of the method used to calculate the settlement. Given the data in the table below: a. Perform a chi-square goodness-of-fit test for the normal distribution at the 5% significance level. b. Perform a K-S test for the same value of alpha. c. What can you conclude from these tests? Observation 1 2 3 4 5 6 7 8 9 10 11 12 13 14 15 16 17 18 19 20 21 22 23 24 25 Ration of Observed to Calculated Settlement 0.12 2.37 1.02 0.94 1 0.97 0.88 1.04 1.06 0.86 0.86 0.92 0.99 1.38 0.82 1.14 1.01 0.87 1.04 0.84 0.94 0.99 0.52 1.18 1.09
