THERMAL CONVECTION
advertisement
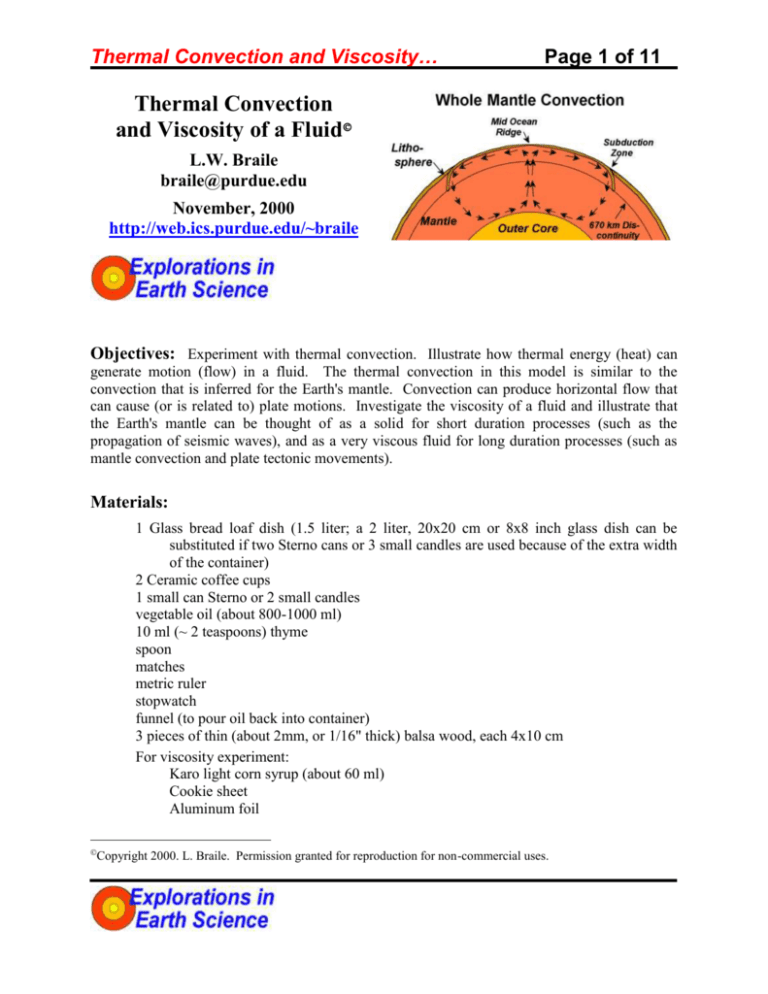
Thermal Convection and Viscosity… Page 1 of 11 Thermal Convection and Viscosity of a Fluid L.W. Braile braile@purdue.edu November, 2000 http://web.ics.purdue.edu/~braile Objectives: Experiment with thermal convection. Illustrate how thermal energy (heat) can generate motion (flow) in a fluid. The thermal convection in this model is similar to the convection that is inferred for the Earth's mantle. Convection can produce horizontal flow that can cause (or is related to) plate motions. Investigate the viscosity of a fluid and illustrate that the Earth's mantle can be thought of as a solid for short duration processes (such as the propagation of seismic waves), and as a very viscous fluid for long duration processes (such as mantle convection and plate tectonic movements). Materials: 1 Glass bread loaf dish (1.5 liter; a 2 liter, 20x20 cm or 8x8 inch glass dish can be substituted if two Sterno cans or 3 small candles are used because of the extra width of the container) 2 Ceramic coffee cups 1 small can Sterno or 2 small candles vegetable oil (about 800-1000 ml) 10 ml (~ 2 teaspoons) thyme spoon matches metric ruler stopwatch funnel (to pour oil back into container) 3 pieces of thin (about 2mm, or 1/16" thick) balsa wood, each 4x10 cm For viscosity experiment: Karo light corn syrup (about 60 ml) Cookie sheet Aluminum foil Copyright 2000. L. Braile. Permission granted for reproduction for non-commercial uses. Thermal Convection and Viscosity… Page 2 of 11 3 small containers, such as 1/8 cup measuring cups Silly Putty 1 Teflon coated pan or cookie sheet Thermal Convection Experiments: Mix the vegetable oil and the thyme (spice) in the loaf dish. Stir thoroughly to distribute the flakes of thyme. Arrange loaf dish and other materials as shown in Figure 1. (Because of the viscosity of the oil and the density of the flakes of thyme, the pieces of thyme are approximately neutrally buoyant. If left unstirred for a long period of time, the thyme will not be evenly distributed in the volume of oil – some of the thyme will tend to float and some tend to sink. However, the thyme stays distributed for a sufficient length of time to perform the experiment. If the thyme becomes significantly separated, just stir to mix thoroughly, let the mixture stand without heat until the flakes of thyme are not moving, and begin the experiment again by adding heat.) 1. Observe the oil and spice mixture. With no heat (energy) being added to the system, these should be little or no movement of the liquid. The flakes of thyme will flow with the liquid, showing the direction and velocity of any fluid flow. 2. Light the Sterno can and let the liquid heat up for a couple of minutes. (If you do not wish to use the Sterno as a source of heat, you can use two small candles (Figure 2) or a coffee cup with a one-cup electric element heater to heat water in the cup and provide heat to the bottom of the loaf dish.) As the oil heats and begins to flow, observe the pattern of fluid flow (circulation) by noting the location of individual flakes of thyme over time (Figure 3). Be sure to view the model several times during the experiment, both from above the dish and from the side of the dish. Draw a sketch of the circulation (copies of Figure 4 can be used as a base diagram for sketching the flow using arrows). Is the pattern approximately symmetric on the two sides of the heated area? Where do you observe upward flow? Where do you see downward flow? Where do you observe horizontal flow? Note that the flow defines a convection cell (actually two cells) in which upward flow above the flame (caused by heating of the fluid which causes expansion and a reduction in density) causes horizontal flow near the surface of the liquid. Cooling of the liquid near the ends of the container increases the density of the liquid and produces sinking and a return horizontal flow toward the center of the container, thus completing a "cycle" of fluid flow in the convection cell. Note that the heat added to the bottom of the container is carried to the surface and distributed primarily by movement of the heated liquid (convection current) rather than by conduction. This type of energy movement is called thermal convection because added heat causes the fluid flow (circulation by convection) by lowering the density of the liquid. The difference in temperature between the near surface region of the oil measured above the heat source and near the ends of the loaf Thermal Convection and Viscosity… Page 3 of 11 dish (far from the heat) will be about 2-3C and can be observed using a sensitive thermometer. (It is not necessary to heat the oil for a long time, or to a high temperature, to cause convection. The convection will begin shortly after the heat is applied to the bottom of the loaf dish. The heating time will be somewhat longer using the candles.) 3. Measure the horizontal velocity of the convective flow near the surface of the liquid by placing a metric ruler on the top of the container (oriented along the long direction of the loaf dish). By looking down on the convecting fluid and observing an individual flake of thyme, measure the distance that one flake moves in a period of time such as 10 or 20 seconds or more. (One can also perform this measurement by viewing from the side of the dish.) Divide the distance (in cm) by the time to determine the velocity in cm/s (usually slower than about 1 cm/s). Measure the velocity and direction of movement at several locations for the near-surface flow of the liquid. Are all of the measurements approximately the same? Where are the velocities the largest? Where are they the smallest? What could explain these variations in velocity? Are the directions of flow "away from" the heated central area of the container? What effects or characteristics of the model might cause variability in the velocities? 4. Place the thin pieces of balsa wood on the surface of the liquid as shown in Figure 5. Observe the motion of the pieces of wood (representing the relatively rigid parts of plates such as most continental regions) over time. You should see plate separation or divergence (analogous to continental rifting and subsequent sea floor spreading of the oceanic lithosphere along mid-ocean ridges) at the center of the container where significant upward fluid flow is caused by the heating. (Because of surface tension, the two pieces of wood at the center of the loaf dish may tend to "stick together". In this case, use a pencil or other tool to slightly separate the wood. Once the surface tension is reduced, the plates will move with the underlying fluid flow.) Additionally, as time progresses, two of the plates should collide analogous to the continental collision that often accompanies subduction where two plates are moving towards each other (converging). Using a metric ruler as in step 3, measure the velocity of one of the pieces of wood. How does this velocity compare to the fluid flow velocities that were obtained previously? Convection in the Earth: Thermal convection is inferred to exist on a large scale in at least two regions in the Earth. The liquid outer core and the upper mantle that behaves as a solid for seismic wave propagation and as a very viscous fluid for long duration geologic processes including convection. The heat that causes convection within the Earth comes from two sources – original heat from accretion and heat released during radioactive decay of unstable isotopes. Although the Earth is about 4.5 billion years old, some heat remains from the accretionary process during its formation because fragments of Earth materials were heated to very high temperatures by impact during formation of the planet, and Earth materials have relatively low thermal conductivity so that significant heat has been retained from the early stages of Earth history. A more important source of heat, however, is the natural, spontaneous, radioactive decay of unstable isotopes of elements that are distributed throughout the Earth, particularly in Thermal Convection and Viscosity… Page 4 of 11 the crust and mantle. These radioactive elements include Uranium, Thorium and Rubidium. These sources of heat cause the Earth's temperature to increase with depth to a temperature of about 5000C in the inner core. The Earth's outer core is inferred to be mostly liquid iron. Convective flow within the outer core not only brings heat to the core-mantle boundary where some of it is transferred into the mantle, but also causes the Earth's magnetic field by motions of the electrically conductive inner core material. Temperatures are hot enough in the upper mantle 1200C to cause thermal convection of the highly viscous upper mantle rocks, although the flow velocity is apparently very low - on the order of cm/yr. Mantle convection in either the upper mantle or the whole mantle has been suggested (Figure 6). The mantle flow is a likely cause of plate tectonic motions. There is still considerable debate about the details of convection in the mantle and the relationship of convection to plate tectonics. For example, there is evidence from the identification of subducted slabs in the Earth's upper mantle, that lithospheric slabs (subducted plates) sometimes extend (penetrate) to depths greater than the upper mantle (below the mantle transition zone, including the 670 km discontinuity, where seismic wave velocity increases rapidly with depth indicating changes in composition or crystalline structure or "packing" of mantle minerals). Therefore, mantle convection may not be as simple as the upper mantle convection or whole mantle convection models that are illustrated in Figure 6. Similarly, the exact relationship of mantle convection to plate motions is not presently known. Mantle convection could be the primary cause of plate tectonics. Alternatively, mantle convection could be a more passive response to plate motions. In either case, it appears clear that heat within the Earth is the ultimate driving force for plate tectonics and mantle convection. For more information on plate tectonics and mantle convection, see almost any recent, introductory, college-level textbook on geology, such as Press and Siever (1994), Lutgens and Tarbuck (1999), or Skinner and Porter (1999). Viscosity Experiments: Newtonian viscosity is a law of friction for fluids. Viscosity is defined as the shearing stress divided by the rate of shear for the fluids. Shearing stress is the force per unit area (at a point) directed parallel to the direction of shear or flow. Viscosity can be thought of as resistance of a fluid to flow. For example, if a fluid (such as water) flows easily, it has low viscosity; if it does not flow easily (such as molasses, honey, or heavy oil), it has higher viscosity. Viscosity is measured in units of Pascal-seconds (Pa-s) which are equivalent to Newton-seconds/m2. 1. To illustrate the meaning of shearing stress and viscosity and show the differing viscosities of two fluids, try the following experiment. Place a piece of the balsa wood on the surface of the oil in the loaf dish. Press down very lightly on the wood with your finger (to create friction between your finger and the wood) and then push horizontally (parallel to the surface of the fluid) on the wood. Note that it takes very little force to move the piece of wood. The viscosity of the fluid is low, equivalent to a small shearing stress (in the definition of Newtonian viscosity given above) and a large rate of shear or flow. Note also that the movement of the wood along the surface has virtually no effect on the rest of the fluid. The oil, and the thyme in the Thermal Convection and Viscosity… Page 5 of 11 oil, do not flow (except for the oil immediately below the wood or adjacent to the sides of the wood which is affected by surface tension of the oil). In addition to illustrating the low viscosity of this fluid, this experiment demonstrates that fluids are not capable of sustaining or propagating shear stresses (the movement of the wood and associated movement of the fluid adjacent to the wood do not cause flow in the remaining volume of the oil), and thus do not propagate seismic shear waves, which, in solids, involve shearing motion and shear stresses. 2. Next, make a cube out of a piece of silly putty. The silly putty can be thought of as an elastic solid for short-duration stresses (if you roll it into a ball, it will bounce off the floor, similar to a rubber ball, if dropped), and a viscous fluid for longer time processes (note also the viscosity comparison illustration described below). Place the cube of silly putty on a table and place a piece of balsa wood on top of the cube. Using the same procedure as in the previous experiment, push down lightly on the wood (just above the silly putty cube) and push horizontally. Continue to apply a force in the horizontal direction. After some time (many seconds), the flow in the silly putty will be visible and the cube will be distorted by shearing. In this experiment, the shearing stress is larger (you have to push harder on the silly putty in a horizontal direction to get the silly putty to flow) and the rate of shear is much slower. Therefore, according to the definition of Newtonian viscosity (shear stress/rate of shear), the viscosity of the silly putty is much higher than the oil. 3. To investigate the viscosity of some fluids and to demonstrate that viscosity of a fluid is also influenced by additional effects, such as temperature of the fluid, try the following experiment. Line a large cookie sheet with aluminum foil and make an inclined plane by placing one side of the cookie sheet on the ceramic cups, thus raising that side by about 10 cm. Draw a short horizontal line on the foil near the top of the inclined plane and an additional line about 10 cm "downslope" from the first line. In sequence, pour the following fluids (about 20 ml each) onto the foil just above the first line: water, Karo syrup heated to 40C, Karo syrup at room temperature (~ 20C), refrigerated Karo syrup (~5C). (Use the 3 measuring cups for the syrup; heat the syrup in one container; refrigerate the syrup in one container; and use the third container for the room temperature water and room temperature syrup.) Using the stopwatch, time how long it takes for the liquid to flow the 10 cm from the upper line to the lower line (one experiment resulted in the following times: water: 0.5s; heated syrup: 2s; room-temperature syrup: 6s; refrigerated syrup: 24s). Prepare a data table showing the fluid, temperature and flow time to allow easy comparisons and analysis of the results. The viscosity of these fluids is roughly proportional to the length of time of flow (or inversely proportional to the flow velocity). The water has the lowest viscosity and the refrigerated Karo syrup has the highest viscosity of these fluids. Note also that the viscosity of the Karo syrup was greatly affected by temperature with the higher temperature corresponding to lower viscosity. In general, viscosity of a fluid is controlled not only by the composition of Thermal Convection and Viscosity… Page 6 of 11 the fluid, but also by the pressure and temperature of the fluid, and sometimes by the size and duration of the stress that causes fluid flow. Examples of viscosities for some common fluids and some Earth materials are shown in Table 1. Note that there is a very large range of viscosities. Also; note that the viscosity of the Earth's mantle is very large. Mantle rocks, even at high pressure and temperature, behave approximately as solids except over long time periods or when the rock is molten (melted to convert the solid to a liquid) such as in magma chambers. Magma chambers have been identified in the hot mantle beneath midocean ridges and in the crust beneath volcanoes. Mantle flow (thermal convection of the mantle) occurs with very low rates (velocity of flow of a few cm/year). (Challenge question: How much faster is the flow velocity of the vegetable oil in the thermal convection model experiment as compared to mantle flow velocities?) Finally, place a ball of silly putty on a Teflon coated pan or cookie sheet. Tilt the pan or cookie sheet to form a steep (at least 45 degree slope) inclined plane. Place a strip of tape (about 10 cm long) beside the silly putty and put a mark on the tape to mark the position of the "leading edge" of the silly putty. Let sit for several days. Check the position of the lower edge of the silly putty every day or two and mark the position. The silly putty will slowly flow down the inclined plane. Flow will occur faster if the silly putty is located in a relatively warm place. Note that the silly putty is far more viscous than the water or syrup used in the earlier experiment. Related Activities: Investigation of Density – GEMS; Plate Puzzle; Plate Tectonics Flip Book; Earth's Interior Structure; Investigating Plate Tectonics Using Foam Models; View the video "Inside Hawaiian Volcanoes" (Smithsonian) to see convection currents in a lava lake and lava lake analogies to plate tectonics (plate separation and divergence, transform faulting, and plate collision and subduction). References: Atwater, T., Continental Drift and Plate Tectonics, videotape, 20 minutes, 1988, (to order: send check for $15 payable to the "Regents of the University of California" requesting the 1988 Continental Drift and Plate Tectonics videotape to: Rick Johnson, Instructional Consultation, UC-Santa Barbara, Santa Barbara, CA 93106). Lutgens, F.K., and E.J. Tarbuck, Foundations of Earth Science, Prentice Hall, Upper Saddle River, New Jersey, 454 pp., 1999, (Chapter 5 on Plate Tectonics). Press, R., and R. Siever, Understanding Earth, (3rd edition), W.H. Freeman, New York, 682 pp., 1994, (Chapter 20 on Plate Tectonics). Thermal Convection and Viscosity… Page 7 of 11 Simkin, T., J.D. Unger, R.I. Tilling, P.R. Vogt, and H. Spall, This Dynamic Planet – A World Map of Volcanoes, Earthquakes, Impact Craters, and Plate Tectonics, Smithsonian Institution and U.S. Geological Survey, Map – 1:30,000,000 scale, 1994, (1-888-ASKUSGS; http://pubs.usgs.gov/pdf/planet.html). Skinner, B., S. Porter, and D. Botkin, The Blue Planet: An Introduction to Earth System Science, (2nd edition), J. Wiley, New York, 1999. Smithsonian Institution, Inside Hawaiian Volcanoes, (http://nmnhwww.si.edu/gvp/products/inv.htm). videotape, 25 minutes, Table 1: Viscosity of Selected Fluids and Materials Fluid/Material Temperature (C) Viscosity (Pa-s; Pascal-seconds = Newton-seconds/m2)* Air Water Honey Flowing hot lava (Hawaiian volcano) Glass Ice Rock Salt Shallow mantle Asthenosphere Deep mantle 20 20 20 ~ 1150 1.8 10-5 1.0 10-3 1.6 ~ 80 ~ 20 0 20 ~ 1000 ~ 1300 > 1500 ~ 1012 ~ 1012 ~ 1014 ~ 1023-1024 ~ 1019-1020 ~ 1021-1022 *Viscosity is often given in units of Poise; 10 Poise = 1 Pa-s. 1989, Thermal Convection and Viscosity… Page 8 of 11 Figure 1. Arrangement of coffee cups, Sterno can and loaf dish on a table top (side view) for the thermal convection experiment. Short lines represent flakes of thyme in the oil. Arrows show expected directions of fluid flow defining convection cells after heating of the fluid. Figure 2. Alternate setup using two candles instead of the sterno for heat. Thermal Convection and Viscosity… Page 9 of 11 Figure 3. Close-up photo (side view) of the oil and thyme in the loaf dish. Heat from the candles causes the oil and thyme to rise in the middle of the dish (above the candle flames), flow horizontally (away from the center) near the surface of the oil, sink near the cooler edges of the loaf dish and flow horizontally toward the center along the bottom of the dish, thus completing the convection cells. Thermal Convection and Viscosity… Page 10 of 11 Figure 4. Sketch of fluid flow experiment apparatus. Copies of this figure can be used to record observed directions of fluid flow (using arrows drawn on the diagram) in the oil after convection begins when heat is added. Figure 5. Arrangement of 3 pieces of balsa wood on the surface of the oil (view from above the dish) to illustrate "plate motions". Thermal Convection and Viscosity… Page 11 of 11 Figure 6. Hypothetical cross-sections through the Earth showing possible patterns of convection. Upper diagram: Schematic diagram illustrating convection in the Earth's upper mantle. Lower diagram: Schematic diagram illustrating convection in the Earth's mantle in which the convection cell and related flow operate throughout the mantle.
