Organisms and pH
advertisement
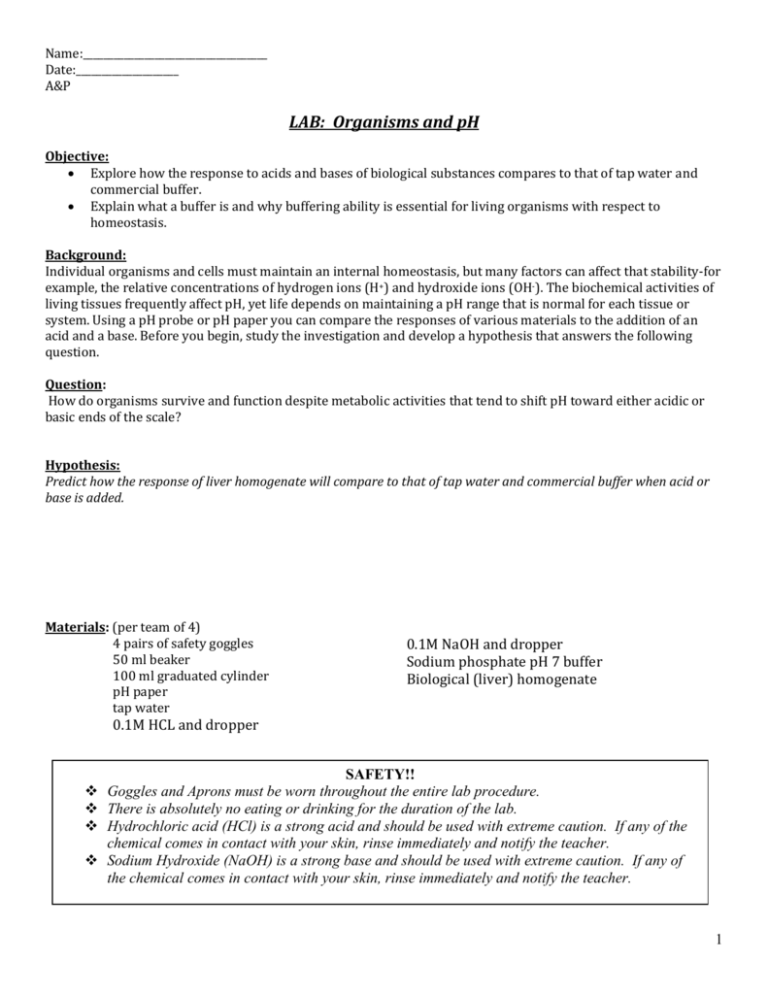
Name:____________________________________ Date:____________________ A&P LAB: Organisms and pH Objective: Explore how the response to acids and bases of biological substances compares to that of tap water and commercial buffer. Explain what a buffer is and why buffering ability is essential for living organisms with respect to homeostasis. Background: Individual organisms and cells must maintain an internal homeostasis, but many factors can affect that stability-for example, the relative concentrations of hydrogen ions (H+) and hydroxide ions (OH-). The biochemical activities of living tissues frequently affect pH, yet life depends on maintaining a pH range that is normal for each tissue or system. Using a pH probe or pH paper you can compare the responses of various materials to the addition of an acid and a base. Before you begin, study the investigation and develop a hypothesis that answers the following question. Question: How do organisms survive and function despite metabolic activities that tend to shift pH toward either acidic or basic ends of the scale? Hypothesis: Predict how the response of liver homogenate will compare to that of tap water and commercial buffer when acid or base is added. Materials: (per team of 4) 4 pairs of safety goggles 50 ml beaker 100 ml graduated cylinder pH paper tap water 0.1M NaOH and dropper Sodium phosphate pH 7 buffer Biological (liver) homogenate 0.1M HCL and dropper SAFETY!! Goggles and Aprons must be worn throughout the entire lab procedure. There is absolutely no eating or drinking for the duration of the lab. Hydrochloric acid (HCl) is a strong acid and should be used with extreme caution. If any of the chemical comes in contact with your skin, rinse immediately and notify the teacher. Sodium Hydroxide (NaOH) is a strong base and should be used with extreme caution. If any of the chemical comes in contact with your skin, rinse immediately and notify the teacher. 1 Procedure: 1. Pour 25 ml of tap water into beaker or jar 2. Record the initial pH using the pH paper 3. Add 0.1M HCL a drop at a time. Gently swirl the mixture after each drop. Determine the pH after 5 drops have been added. Repeat this procedure until 30 drops have been used. Record the pH measurements in Table 1. 4. Rinse the beaker thoroughly and pour into it another 25 ml of tap water. Record the initial pH of the water and 0.1M NaOH drop by drop, recording the pH changes in exactly the same way as for the o.1M HCL. 5. Using 25mL of biological homogenate (liver), instead of tap water, repeat steps 2-4 and record the data in Table 1. 6. Finally, test the buffer solution ( a nonliving chemical solution) using the same method outlined in steps 24. Record the data in your table. 7. Wash your hands Results: Table 1:_____________________________________________________________________________ Solution pH change with 1M HCl (5 drop increments) pH change with 1M HCl (5 drop increments) Tested 0 5 10 15 20 25 30 0 5 10 15 20 25 30 Tap Water Biological Homogenate Commercial Buffer Growth (cm) Analysis: Create a line graph comparing the pH change in tap water, liver homogenate and commercial buffer after the addition of HCl Create a second line graph comparing the pH change in tap water, liver homogenate and commercial buffer after the addition of NaOH Refer to the following guidelines when creating a graph o Hand drawn graphs must be in pencil. o Y-axis is the dependent variable (results) and X-axis is the independent variable o Axes should be labeled. Be sure to include units. o Graphs should be labeled as Figures (Fig 1, Fig 2 etc.) and given an underlined title in the “y” v. “x” format. (ex. Fig 1: Breathing Rate v. Temperature) The units do not need be included again in the Growth v. Time title. o Graphs with more than one line should use point protectors (see below) to distinguish between 12 lines and must include a key. o Point protectors refer to enclosing the “dots” on different lines with a different shape (circle, square 10 etc), and are considered more sophisticated than using color or dashes to distinguish between lines. Excel graphs will use different shaped dots to8distinguish and point protectors mimic this. Series1 Calculate the percent change in % for each solution for both NaOH and HCl. 6 Series2 % Change = (Final – Initial/Initial) x 100 4 Series3 Conclusion: 2 Address the objectives and summarize what you learned as well as what the results indicate. 0 Do the results support or refute your hypothesis or were your results inconclusive? 1 2 4 Were there any sources of error/problems with the experimental design? If 3so, how could you5 address these issues? Time (days) What new questions have you developed based on the results of this experiment that could lead to further investigation? 2
