11 Million Reasons To Become Diverse - Handout
advertisement

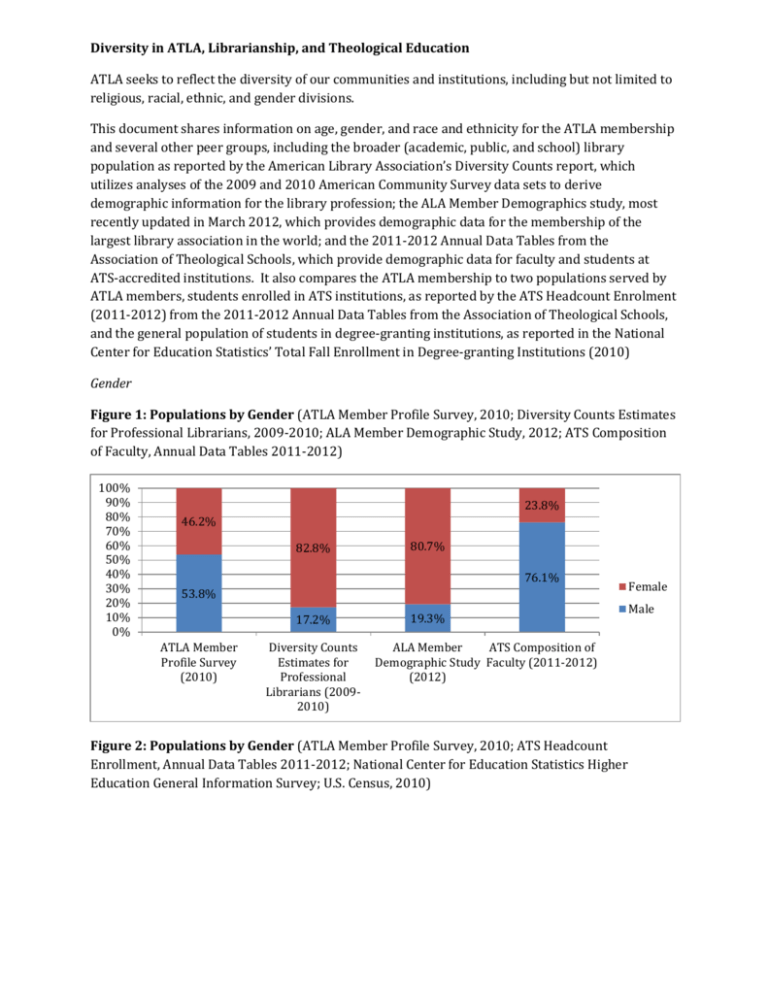
Diversity in ATLA, Librarianship, and Theological Education ATLA seeks to reflect the diversity of our communities and institutions, including but not limited to religious, racial, ethnic, and gender divisions. This document shares information on age, gender, and race and ethnicity for the ATLA membership and several other peer groups, including the broader (academic, public, and school) library population as reported by the American Library Association’s Diversity Counts report, which utilizes analyses of the 2009 and 2010 American Community Survey data sets to derive demographic information for the library profession; the ALA Member Demographics study, most recently updated in March 2012, which provides demographic data for the membership of the largest library association in the world; and the 2011-2012 Annual Data Tables from the Association of Theological Schools, which provide demographic data for faculty and students at ATS-accredited institutions. It also compares the ATLA membership to two populations served by ATLA members, students enrolled in ATS institutions, as reported by the ATS Headcount Enrolment (2011-2012) from the 2011-2012 Annual Data Tables from the Association of Theological Schools, and the general population of students in degree-granting institutions, as reported in the National Center for Education Statistics’ Total Fall Enrollment in Degree-granting Institutions (2010) Gender Figure 1: Populations by Gender (ATLA Member Profile Survey, 2010; Diversity Counts Estimates for Professional Librarians, 2009-2010; ALA Member Demographic Study, 2012; ATS Composition of Faculty, Annual Data Tables 2011-2012) 100% 90% 80% 70% 60% 50% 40% 30% 20% 10% 0% 23.8% 46.2% 82.8% 80.7% 76.1% 53.8% 17.2% ATLA Member Profile Survey (2010) Diversity Counts Estimates for Professional Librarians (20092010) 19.3% ALA Member ATS Composition of Demographic Study Faculty (2011-2012) (2012) Figure 2: Populations by Gender (ATLA Member Profile Survey, 2010; ATS Headcount Enrollment, Annual Data Tables 2011-2012; National Center for Education Statistics Higher Education General Information Survey; U.S. Census, 2010) Female Male 100% 90% 80% 70% 34.30% 46.2% 50.80% 56.96% 60% 50% Female 40% 30% 20% Male 65.70% 53.8% 49.20% 43.03% 10% 0% ATLA Member Profile Survey (2010) ATS Headcount Enrollment (2011-2012) Total fall enrollment in degree-granting institutions (2010) 2010 Census of U.S. Population Age Figure 3: Populations by Age (ATLA Member Profile Survey, 2010; Diversity Counts Estimates for Professional Librarians, 2009-2010; ALA Member Demographic Study, 2012) 100% 90% 13.0% 80% 70% 33.0% 5.2% 9.5% 34.8% 27.7% 65 or Older 60% 50% 40% 30% 20% 10% 0% 20.6% 25.6% 20.3% 55-64 45-54 20.5% 21.0% 21.4% 12.7% 12.9% ATLA Member Profile Survey (2010) 35-44 Under 35 21.7% Diversity Counts Estimates ALA Member Demographic for Professional Librarians Study (2012) (2009-2010) Figure 4: Populations by Age (ATLA Member Profile Survey, 2010; ATS Headcount Enrollment, Annual Data Tables 2011-2012; National Center for Education Statistics Higher Education General Information Survey) ATLA Member Profile Survey (2010) 40.0% 33.0% 30.0% 20.0% 10.0% ATS Headcount Enrollment (2011-2012) 12.7% 21.0% 20.3% 13.0% 0.0% Under 35-44 45-54 55-64 65 or 35 Older 50.00% 40.00% 30.00% 20.00% 10.00% 0.00% 45.48% 11.11% 19.75%19.45% 1.78% Under 35-39 40-49 50-64 65 or 35 older Total fall enrollment in degree-granting institutions (2010) 100.00% 80.00% 60.00% 40.00% 20.00% 0.00% 81.25% 18.75% Under 35 35 and older Race and Ethnicity Figure 5: Populations by Race and Ethnicity-White and Non-White Populations (ATLA Member Profile Survey, 2010; Diversity Counts Estimates for Professional Librarians, 2009-2010; Diversity Counts Estimates for Professional Academic Librarians, 2009-2010; ALA Member Demographic Study, 2012; ATS Composition of Faculty, Annual Data Tables 2011-2012) 100% 90% 80% 70% 60% 50% 40% 30% 20% 10% 0% 10.70% 12.00% 13.90% 11.30% 20.00% 89.30% 88.00% 86.10% 88.70% 80.00% Non-White White ATLA Member Diversity Profile Survey Counts (2010) Estimates for Professional Librarians (2009-2010) Diversity Counts Estimates for Professional Academic Librarians (2009-2010) ALA Member ATS Demographic Composition of Study (2012) Faculty (20112012) Note for Figure 5: The ATLA Member Profile Survey included an “Other” option and these responses have been included in the “NonWhite” category; Diversity Counts includes individuals selecting “Two Or More Races” and these responses have been included in the “Non-White” category; ATS includes data on individuals selecting "Visa or Nonresident Alien," "Multiracial," and "Not Available" and these responses have been included in the “Non-White” category. Figure 6: Populations by Race and Ethnicity- Non-White Populations as Percentages of Total Population (ATLA Member Profile Survey, 2010; Diversity Counts Estimates for Professional Librarians, 2009-2010; Diversity Counts Estimates for Professional Academic Librarians, 20092010; ALA Member Demographic Study, 2012; ATS Composition of Faculty, Annual Data Tables 2011-2012) 20.00% 3.50% 18.00% 16.00% 14.00% 12.00% 10.00% 8.00% 6.00% 4.00% 2.00% 0.00% 1.80% 3.30% 0.40% 2.60% 2.60% 3.10% 0.85% 0.20% 2.70% 5.20% ATLA Member Diversity Profile Survey Counts (2010) Estimates for Professional Librarians (2009-2010) 2.60% 0.90% 0.20% 4.80% 5.40% Diversity Counts Estimates for Professional Academic Librarians (2009-2010) 3.46% 0.10% 3.70% 0.10% 1.10% 5.40% Hispanic Other 3.90% American Indian or Alaska Native 7.50% 4.50% Asian or Pacific Islander Black/African American ALA Member ATS Demographic Composition of Study (2012) Faculty (20112012) Note for Figure 6: The ATLA Member Profile Survey included an “Other” option where individuals could provide their own response; Diversity Counts includes individuals selecting “Two Or More Races” and these responses have been included in the “Other” category; ATS includes data on individuals selecting "Visa or Nonresident Alien," "Multiracial," and "Not Available" and these responses have been included in the “Other” category. Figure 7: Populations by Race and Ethnicity-White and Non-White Populations (ATLA Member Profile Survey, 2010; ATS Headcount Enrollment, Annual Data Tables 2011-2012; National Center for Education Statistics Higher Education General Information Survey; U.S. Census, 2010) 100% 90% 80% 70% 60% 50% 40% 30% 20% 10% 0% 10.70% 43.50% 39% 36% 56.50% 61% 64.00% ATS Headcount Enrollment (20112012) Racial Representation Among College Students (2010) 2010 Census of U.S. Poulation 89.30% ATLA Member Profile Survey (2010) Non-White White Note for Figure 7: The ATLA Member Profile Survey included an “Other” option and these responses have been included in the “NonWhite” category; ATS includes data on individuals selecting "Visa or Nonresident Alien," "Multiracial," and "Not Available" and these responses have been included in the “Non-White” category; NCES includes data on individuals selecting “Two or More Races” and “Nonresident Alien” and these have been included in the “Non-White” category; U.S. Census includes data on individuals selecting “Some Other Race” and “Two or More Races” and these responses have been included in the “Non-White Category,” for U.S. Census data “White” includes only those selecting “Not Hispanic or Latino” and “White Alone” Figure 8: Populations by Race and Ethnicity- Non-White Populations as Percentages of Total Population (ATLA Member Profile Survey, 2010; ATS Headcount Enrollment, Annual Data Tables 2011-2012; National Center for Education Statistics Higher Education General Information Survey; U.S. Census, 2010) 45.00% 40.00% 35.00% 30.00% 25.00% 20.00% 15.00% 1.80% 10.00% 3.30% 0.40% 5.00% 2.60% 2.60% 0.00% 4.80% 17.90% 13% 0.33% 7.10% 5% 1% 6% 12.60% 14% 14.60% 3.00% 0.90% 5.00% Hispanic 12.60% Other American Indian or Alaska Native Asian or Pacific Islander Black/African American Note for Figure 8: The ATLA Member Profile Survey included an “Other” option where individuals could provide their own response; ATS includes data on individuals selecting "Visa or Nonresident Alien," "Multiracial," and "Not Available" and these responses have been included in the “Other” category; NCES includes data on individuals selecting “Two or More Races” and “Nonresident Alien” and these have been included in the “Other” category; U.S. Census includes data on individuals selecting “Some Other Race” and “Two or More Races” and these responses have been included in the “Other,” for U.S. Census data “Hispanic” includes only those selecting “Hispanic or Latino” and “White” or “Some Other Race” from the racial categories

![June 2013 [DOCX 24.38KB]](http://s3.studylib.net/store/data/006990913_1-45414924984da7777020f5c1725fdda9-300x300.png)


