Lab 1 - kaylajoyromeo
advertisement
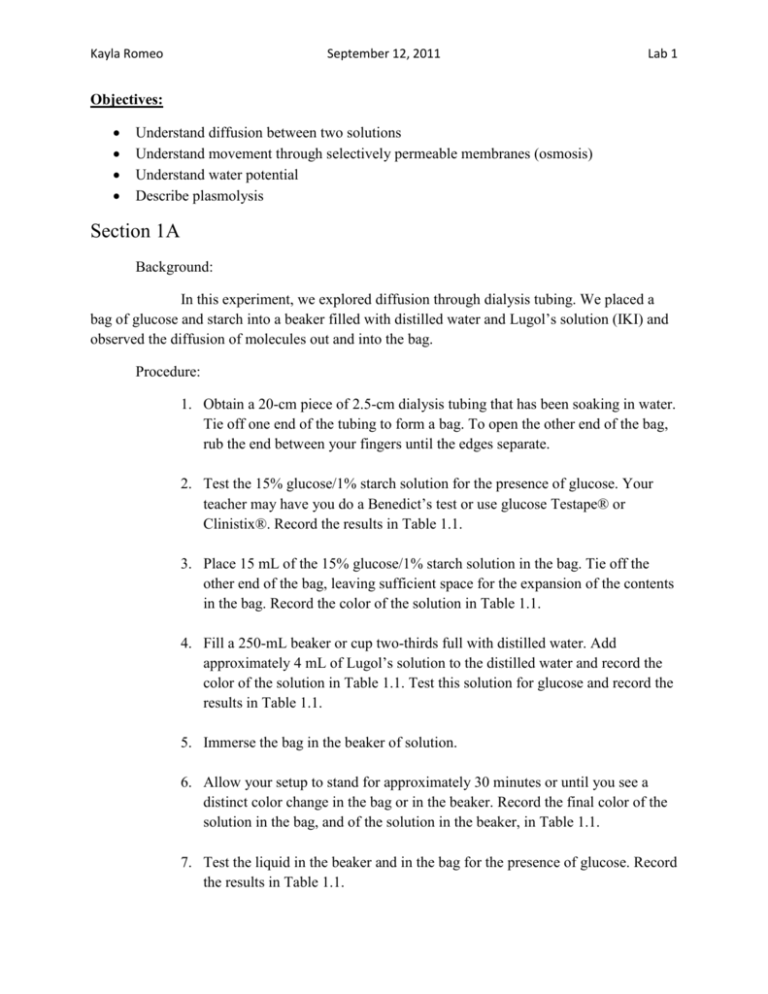
Kayla Romeo September 12, 2011 Lab 1 Objectives: Understand diffusion between two solutions Understand movement through selectively permeable membranes (osmosis) Understand water potential Describe plasmolysis Section 1A Background: In this experiment, we explored diffusion through dialysis tubing. We placed a bag of glucose and starch into a beaker filled with distilled water and Lugol’s solution (IKI) and observed the diffusion of molecules out and into the bag. Procedure: 1. Obtain a 20-cm piece of 2.5-cm dialysis tubing that has been soaking in water. Tie off one end of the tubing to form a bag. To open the other end of the bag, rub the end between your fingers until the edges separate. 2. Test the 15% glucose/1% starch solution for the presence of glucose. Your teacher may have you do a Benedict’s test or use glucose Testape® or Clinistix®. Record the results in Table 1.1. 3. Place 15 mL of the 15% glucose/1% starch solution in the bag. Tie off the other end of the bag, leaving sufficient space for the expansion of the contents in the bag. Record the color of the solution in Table 1.1. 4. Fill a 250-mL beaker or cup two-thirds full with distilled water. Add approximately 4 mL of Lugol’s solution to the distilled water and record the color of the solution in Table 1.1. Test this solution for glucose and record the results in Table 1.1. 5. Immerse the bag in the beaker of solution. 6. Allow your setup to stand for approximately 30 minutes or until you see a distinct color change in the bag or in the beaker. Record the final color of the solution in the bag, and of the solution in the beaker, in Table 1.1. 7. Test the liquid in the beaker and in the bag for the presence of glucose. Record the results in Table 1.1. Kayla Romeo September 12, 2011 Lab 1 Table 1.1 Bag Beaker Initial Contents 15% glucose and 1% starch Water and IKI Solution Color Initial Final Cloudy Bluish white purple Presence of Glucose Initial Final Yes (1000 Yes (5000+ mg/dL) mg/dL) Golden (like apple juice) None Golden (like apple juice) Yes (250 mg/dL) Results 1. Iodine seemed to enter the bag since the bag changed colors, due to the fact that iodine is a starch indicator. The contents of the bag went from a cloudy white to a bluish purple after being immersed in the water and IKI solution. Glucose is leaving the bag since there was a presence of glucose in the water and IKI solution after the bag was immersed in it. We tested for glucose with a strip and it showed the presence of 250 mg/dL of glucose. 2. Since there was more solute in the bag, the water concentration was less in the bag than it was in the outside solution. Due to the selectively permeable membrane, glucose, iodine, and water could diffuse across the membrane. It seems as though starch can’t pass through because if it could have, the solution in the beaker would have changed colors. 3. This experiment could be modified by measuring the dialysis bags before and after we put them into the water/IKI solution. This would have allowed for us to see if water entered the bag or not. 4. Based on our observations, water molecules are the smallest. The next biggest is glucose molecules, followed by IKI molecules, membrane pores, and starch molecules. 5. If the experiment started with glucose and IKI solution inside the bag and only starch and water outside, I would expect the contents of the bag to remain white while the contents outside of the bag changed to blue. The iodine would diffuse across the membrane and react with the starch molecules to create a blue-purple color. Conclusion Based on our data that we collected, it seems as though iodine moved into the dialysis bag and glucose moved out of the bag. I think that our final test for the presence of glucose in the bag was a little off though. It seems as though the glucose shouldn’t have gone up, but it did quite significantly. We can’t tell if water moved into or out of the bag, but we can assume that water diffused into the bag. Kayla Romeo September 12, 2011 Lab 1 Section 1B Background In this experiment, we will examine the movement of water, otherwise known as osmosis, through a selectively permeable membrane. Water tends to move from an area of low concentration to an area of high concentration. In this experiment, water will most likely move from a hypotonic solution to a hypertonic solution. Figure 1.1 blue- hypertonic yellow- hypotonic Procedure 1. Obtain six 30-cm strips of presoaked dialysis tubing. 2. Tie a knot in one end of each piece of dialysis tubing to form 6 bags. Pour approximately 15-25 mL of each of the following solutions into separate bags: a. Distilled water b. 0.2 M sucrose c. 0.4 M sucrose d. 0.6 M sucrose e. 0.8 M sucrose f. 1.0 M sucrose Remove most of the air from each bag by drawing the dialysis bag between two fingers. Tie off the other end of the bag. Leave sufficient space for the expansion of the contents in the bag. (The solution should fill only about one-third to onehalf of the piece of tubing.) 3. Rinse each bag gently with distilled water to remove any sucrose spilled during the filling. 4. Carefully blot the outside of each bag and record in Table 1.2 the initial mass of each bag, expressed in grams. Kayla Romeo September 12, 2011 Lab 1 5. Place each bag in an empty 250-mL beaker or cup and label the beaker to indicate the molarity of the solution in the dialysis bag. 6. Now fill each beaker two-thirds full with distilled water. Be sure to completely submerge each bag. 7. Let them stand for 30 minutes. 8. At the end of 30 minutes remove the bags from the water. Carefully blot and determine the mass of each bag. 9. Record your group’s data in Table 1.2. Table 1.2 Contents in dialysis bag Distilled water 0.2 M sucrose 0.4 M sucrose 0.6 M sucrose 0.8 M sucrose Initial Mass Final Mass 18.8 g 14.4 g 17.9 g 13.1 g 21.3 g 1.0 M sucrose 17.0 g 19.2 g 15.2 g 20.7 g 15.0 g Not tied tightly enough 21.2 g Mass Difference Percent Change in Mass .4 g 2.1% .8 g 5.6% 2.8 g 15.6% 1.9 g 14.5% N/A N/A 4.1 g 24.1% Graph 1.1 Percent Change in Mass of Dialysis Bags 30.00% 25.00% 20.00% 15.00% Percent Change in Mass of Dialysis Bags 10.00% 5.00% 0.00% Distilled Water 0.2 M sucrose 0.4 M sucrose 0.6 M sucrose 0.8 M sucrose 1.0 M sucrose Kayla Romeo September 12, 2011 Lab 1 Results 1. As the molarity of the sucrose went up, the change in mass of the bags went up also. This happened because the net movement of water was from the distilled water (hypotonic solution) into the dialysis bags filled with different amounts of sucrose (hypertonic solution). 2. If all of the bags were placed in a 0.4 M sucrose solution rather than distilled water, the mass of the bags would increase if they were containing solutions less than 0.4 M sucrose, and they would decrease if the bags were containing solutions more than 0.4 M sucrose. This happens because the solution with more solute is hypertonic and the solution with less solute is hypotonic, therefore the net movement of water would be from the hypotonic into the hypertonic solution. 3. We calculated the percent change in mass rather than the change in mass because all of the bags contained different amounts of the solution. So there was no uniform increase or decrease in just the mass. With the percent change in mass, we can actually compare the bag to another bag. 4. 18 g- 20 g= -2 g -2 g/ 20 g= -0.1 g -0.1 g x 100= -10% Percent change in mass= -10% 5. Hypertonic Conclusion Based on our results, water will always move from a hypotonic solution to a hypertonic solution. As the molarity of the sucrose went up, the percent change in mass also went up. This demonstrates that water was diffusing into the bags. Section 1C Background In this experiment we will explore water potential. Water potential is affected by pressure and the amount of solute. Water potential is when water leaves one area in favor of another area. In plant cells, the cell will expand as water enters the cell, but the cell wall will push back as the cell becomes too saturated. Procedure 1. Pour 100 mL of the assigned solution into a labeled 250-mL beaker. Slice a potato into discs that are approximately 3 cm thick. Kayla Romeo September 12, 2011 Lab 1 2. Use a cork borer (approximately 5 mm in inner diameter) to cut four potato cylinders. Do not include any skin on the cylinders. You need four potato cylinders for each beaker. 3. Keep your potato cylinders in a covered beaker until it is your turn to use the balance. 4. Determine the mass of the four cylinders together and record the mass in Table 1.4. Put the four cylinders into the beaker of sucrose solution. 5. Cover the beaker with plastic wrap to prevent evaporation. 6. Let it stand overnight. 7. Remove the cores from the beakers, blot them gently on a paper towel, and determine their total mass. 8. Record the final mass in Table 1.4. Calculate the percentage change as you did in Exercise 1B. 9. Graph your individual data for the percent change in mass in Table 1.4. Table 1.4 Contents in Beaker Initial Mass Final Mass Mass Difference Distilled Water 0.2 M sucrose 0.4 M sucrose 0.6 M sucrose 0.8 M sucrose 1.0 M sucrose 1.3 g 1.7 g 0.4 g Percent Change in Mass 30.8% 1.3 g 1.4 g 0.1 g 7.7% 2.0 g 2.0 g 0g 0% 1.0 g 0.7 g -0.3 g -30% 0.7 g 0.8 g 0.1 g 14.3% 1.2 g 0.9 g -0.3 g -25% Graph 1.2 Kayla Romeo September 12, 2011 Lab 1 Percent Change in Mass of Potato Cores at Different Molarities of Sucrose 40.00% 30.00% 20.00% 10.00% 0.00% -10.00% -20.00% -30.00% -40.00% Percent Change in Mass of Potato Cores at Different Molarities of Sucrose Distilled Water 0.2 M sucrose 0.4 M sucrose 0.6 M sucrose 0.8 M sucrose 1.0 M sucrose 30.80% 7.70% 0% -30% 14.30% -25% 10. Molar concentration of sucrose= 0.4 M sucrose Conclusion Based on our analysis of results, 0.4 M sucrose was the molar concentration of the potato cores. For anything below 0.4 M sucrose, the mass increased whereas for anything above 0.4 M sucrose the mass decreased. This means that the water potential of anything below 0.4 M sucrose was higher than the potato cores and the water potential of anything above 0.4 M sucrose was lower than the potato cores. Section 1D Questions 2. –(1.0)(0.4)(0.0831)(295) = - 9.8058 bars 1. The water potential of the dehydrated potato core will decrease because all of the water is gone. There is nothing left. 2. The plant cell is hypertonic to its surrounding environment; therefore the cell will gain water because water moves from an area of high concentration to areas of lower concentration. 3. The pressure potential of the system is 0. 4. The greatest water potential is in the dialysis bag. Kayla Romeo September 12, 2011 Lab 1 5. Water will diffuse out of the bag because water moves from a hypotonic solution to a hypertonic solution and the solution in the bag would be considered the hypotonic solution. Graph 1.3 Percent Change in Mass of Zucchini Cores % increase/decrease in mass of cores 30% 20% 10% 0% -10% -20% -30% -40% Percent Change in Mass of Zucchini Cores Distilled Water 0.2 M sucrose 0.4 M sucrose 0.6 M sucrose 0.8 M sucrose 1.0 M sucrose 20% 10% -3% -17% -25% -30% 7b. approximately 0.35 M sucrose 8a. (-1.0)x(0.35)x(0.0831)x(295) = - 8.58 bars 8b. Water potential= 0 + -8.58 bars Water potential= -8.58 bars 9. Adding solute raises the solute potential of that solution. 10a. Distilled Water 10b. Distilled Water 10c. Water would diffuse into the red blood cell and the red blood cell would most likely burst from the pressure of water pushing out through the inside of the cell. Section 1E Background Kayla Romeo September 12, 2011 Lab 1 In this experiment, we investigated plasmolysis. In a plant cell, the cytoplasm shrinking due to water moving out of the cell into a hypertonic solution surrounding the cell is called plasmolysis. We used the epidermis of a red onion for our experiment. Procedure 1. Prepare a wet mount of a small piece of the epidermis of an onion. Observe under 100X magnification. Sketch and describe the appearance of the onion cells. The cell is a purple color and they are arranged semi-uniformly against the other cells. 2. Add 2 or 3 drops of NaCl to one edge of the cover slip. Draw this salt solution across the slide by touching a piece of paper towel to the fluid under the opposite edge of the cover slip. Sketch and describe the onion cells. Explain what has happened. The cell has shriveled up and pulled away from the cell wall because of the water diffusing out of the cell into the NaCl solution. 3. Remove the cover slip and flood the onion epidermis with fresh water. Observe under 100X. Describe and explain what happened. The cells are gradually regaining their original shape because water is being diffused back into the cell. However, the cells won’t fully return to their original size because of the NaCl they absorbed. Results 1. Plasmolysis is when a cell shrivels up and the plasma membrane pulls away from the cell wall because water is being diffused out of the cell into a hypertonic solution outside of the cell. 2. The onion cells plasmolyzed because they were exposed to sodium chloride (NaCl) and the water from inside the cell was diffusing out to try and balance the solution. 3. In winter, grass often dies near roads that have been salted to remove ice because the water from inside the grasses cells is being diffused outside of the cell and into the salt to balance the solution. Conclusion Kayla Romeo September 12, 2011 Lab 1 Based on our results, the onion cells plasmolyzed when we exposed them to sodium chloride. The cells pulled away from the cell wall leaving the purple part shriveled up. When we re-added water, the cells gradually returned back to their starting shape, but they never quite made it back to their starting position because they had already absorbed some of the sodium chloride.
