DOC - StatsTools
advertisement
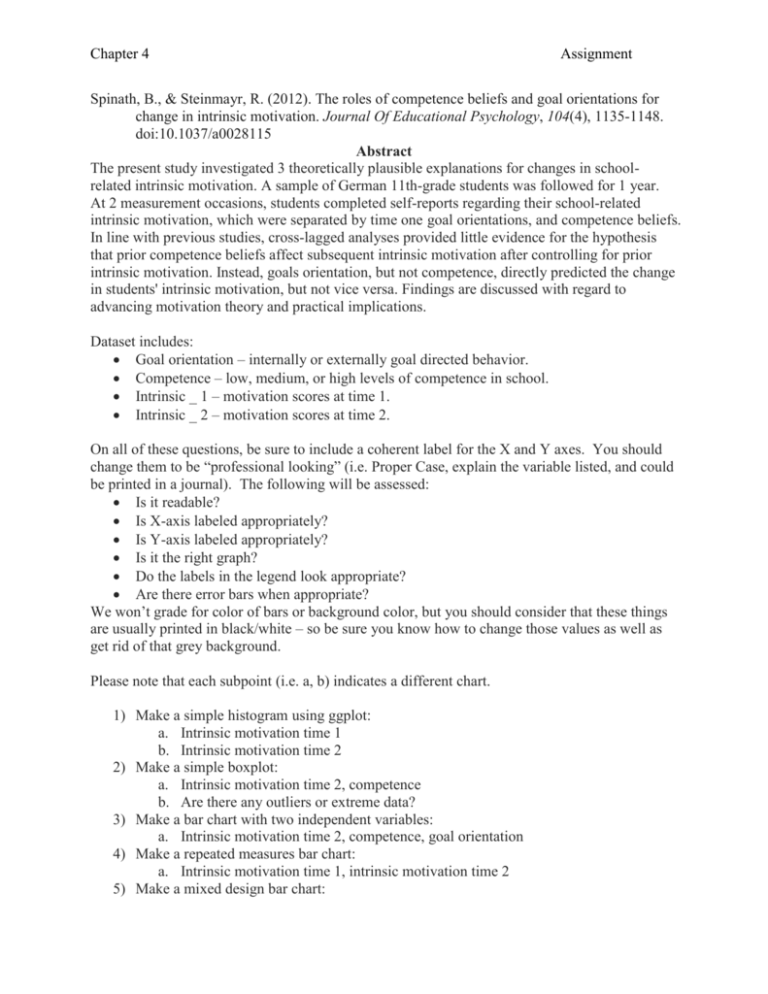
Chapter 4 Assignment Spinath, B., & Steinmayr, R. (2012). The roles of competence beliefs and goal orientations for change in intrinsic motivation. Journal Of Educational Psychology, 104(4), 1135-1148. doi:10.1037/a0028115 Abstract The present study investigated 3 theoretically plausible explanations for changes in schoolrelated intrinsic motivation. A sample of German 11th-grade students was followed for 1 year. At 2 measurement occasions, students completed self-reports regarding their school-related intrinsic motivation, which were separated by time one goal orientations, and competence beliefs. In line with previous studies, cross-lagged analyses provided little evidence for the hypothesis that prior competence beliefs affect subsequent intrinsic motivation after controlling for prior intrinsic motivation. Instead, goals orientation, but not competence, directly predicted the change in students' intrinsic motivation, but not vice versa. Findings are discussed with regard to advancing motivation theory and practical implications. Dataset includes: Goal orientation – internally or externally goal directed behavior. Competence – low, medium, or high levels of competence in school. Intrinsic _ 1 – motivation scores at time 1. Intrinsic _ 2 – motivation scores at time 2. On all of these questions, be sure to include a coherent label for the X and Y axes. You should change them to be “professional looking” (i.e. Proper Case, explain the variable listed, and could be printed in a journal). The following will be assessed: Is it readable? Is X-axis labeled appropriately? Is Y-axis labeled appropriately? Is it the right graph? Do the labels in the legend look appropriate? Are there error bars when appropriate? We won’t grade for color of bars or background color, but you should consider that these things are usually printed in black/white – so be sure you know how to change those values as well as get rid of that grey background. Please note that each subpoint (i.e. a, b) indicates a different chart. 1) Make a simple histogram using ggplot: a. Intrinsic motivation time 1 b. Intrinsic motivation time 2 2) Make a simple boxplot: a. Intrinsic motivation time 2, competence b. Are there any outliers or extreme data? 3) Make a bar chart with two independent variables: a. Intrinsic motivation time 2, competence, goal orientation 4) Make a repeated measures bar chart: a. Intrinsic motivation time 1, intrinsic motivation time 2 5) Make a mixed design bar chart: Chapter 4 Assignment a. Intrinsic motivation time 1, intrinsic motivation time 2, goal orientation 6) Make a simple scatterplot: a. Intrinsic motivation time 1, intrinsic motivation time 2 7) Make a grouped scatterplot: a. Intrinsic motivation time 1, intrinsic motivation time 2, competence
