supplementary material_edited
advertisement
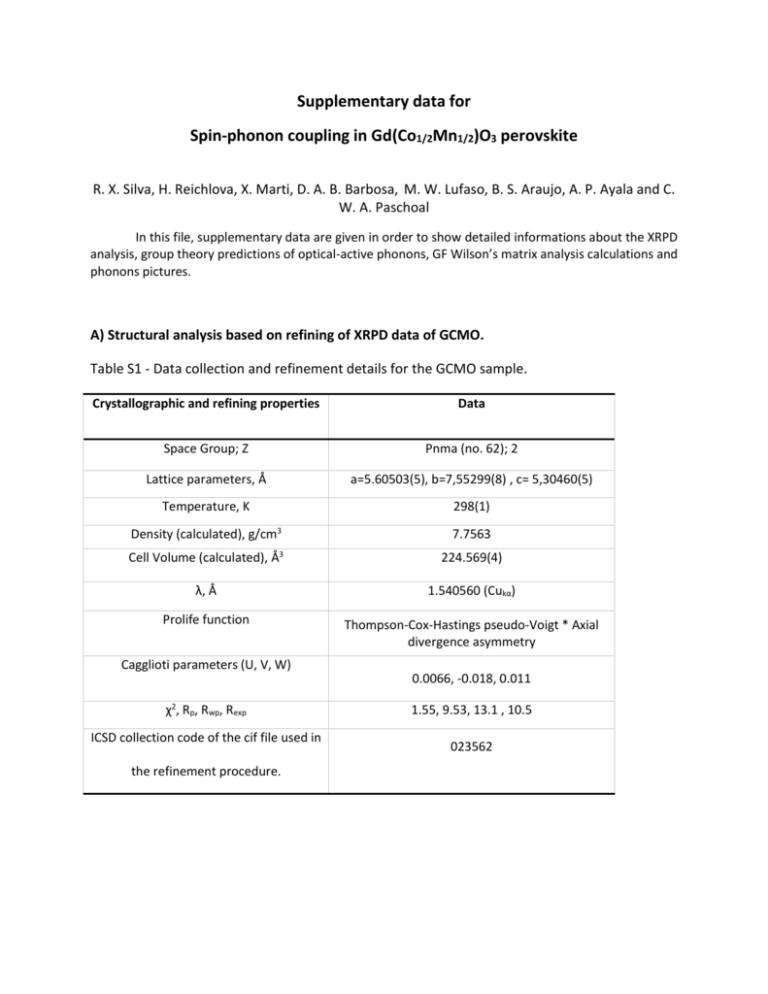
Supplementary data for Spin-phonon coupling in Gd(Co1/2Mn1/2)O3 perovskite R. X. Silva, H. Reichlova, X. Marti, D. A. B. Barbosa, M. W. Lufaso, B. S. Araujo, A. P. Ayala and C. W. A. Paschoal In this file, supplementary data are given in order to show detailed informations about the XRPD analysis, group theory predictions of optical-active phonons, GF Wilson’s matrix analysis calculations and phonons pictures. A) Structural analysis based on refining of XRPD data of GCMO. Table S1 - Data collection and refinement details for the GCMO sample. Crystallographic and refining properties Data Space Group; Z Pnma (no. 62); 2 Lattice parameters, Å a=5.60503(5), b=7,55299(8) , c= 5,30460(5) Temperature, K 298(1) Density (calculated), g/cm3 7.7563 Cell Volume (calculated), Å3 224.569(4) λ, Å 1.540560 (Cukα) Prolife function Thompson-Cox-Hastings pseudo-Voigt * Axial divergence asymmetry Cagglioti parameters (U, V, W) χ2, Rp, Rwp, Rexp ICSD collection code of the cif file used in the refinement procedure. 0.0066, -0.018, 0.011 1.55, 9.53, 13.1 , 10.5 023562 Table S2 – Refined atomic coordinates in the orthorhombic structure of the GCMO sample. Coordinates Ion Site Symmetry x y z Gd3+ 4c Csxz 0.06629(19) 1/4 -0.0158(3) (Co, Mn)3+ 4b Ci 0 0 1/2 1O 4c Csxz 0.4697(19) 1/4 0.098(2) 2O' 8b C1 0.3023(16) 0.0474(11) -0.3027(15) Table S3 - Calculated bond distances in A and B sites for the GCMO sample. Label Bond Distance, Å Gd1--O1 2.281(11) Gd1--O1 2.340(11) Gd1--O2 (×2) 2.336(9) Gd1--O2 (×2) Label Bond Distance, Å Co1/Mn1--O1† 1.966(3) Co1/Mn1--O2† 1.983(8) Co1/Mn1--O2† 2.023(9) 2.620(9) Gd1--O2 (×2) 2.531(8) Gd1--O1 (×2) 3.135(11) Gd1--O1 (×2) 3.3980(11) Gd1--O2 (×2) 3.488(8) Table S4 - Calculated valence sums for the GCMO sample. Ion Bond Valence Sum, v.u. Gd3+ 3.13 Co3+ 2.31 Mn3+ 3.22 O1(2-) 1.99 O2(2-) 1.85 B) Group prediction of Optical-active modes in GCMO Table S5 - Modes distribution in the perovskite crystalline structure belonging to the orthorhombic space group 𝑃𝑛𝑚𝑎. [1] Ion Site Symmetry Distribution of modes Gd3+ 4c Csxz 2𝐴𝑔 ⊕ 𝐴𝑢 ⊕ 𝐵1𝑔 ⊕ 2𝐵1𝑢 ⊕ 2𝐵2𝑔 ⊕ 𝐵2𝑢 ⊕ 𝐵3𝑔 ⊕ 2𝐵3𝑢 (Co, Mn)3+ 4b Ci 3𝐴𝑢 ⊕ 3𝐵1𝑢 ⊕ 3𝐵2𝑢 ⊕ 3𝐵3𝑢 O1 4c Csxz 2𝐴𝑔 ⊕ 𝐴𝑢 ⊕ 𝐵1𝑔 ⊕ 2𝐵1𝑢 ⊕ 2𝐵2𝑔 ⊕ 𝐵2𝑢 ⊕ 𝐵3𝑔 ⊕ 2𝐵3𝑢 O2 8d C1 3𝐴𝑔 ⊕ 3𝐴𝑢 ⊕ 3𝐵1𝑔 ⊕ 3𝐵1𝑢 ⊕ 3𝐵2𝑔 ⊕ 3𝐵2𝑢 ⊕ 3𝐵3𝑔 ⊕ 3𝐵3𝑢 All modes 7𝐴𝑔 ⊕ 8𝐴𝑢 ⊕ 5𝐵1𝑔 ⊕ 10𝐵1𝑢 ⊕ 7𝐵2𝑔 ⊕ 8𝐵2𝑢 ⊕ 5𝐵3𝑔 ⊕ 10𝐵3𝑢 Acoustic/Silent 𝐵1𝑢 ⊕ 𝐵2𝑢 ⊕ 𝐵3𝑢 / 8𝐴𝑢 Raman 7𝐴𝑔 ⊕ 5𝐵1𝑔 ⊕ 7𝐵2𝑔 ⊕ 5𝐵3𝑔 = 24 Raman active modes Infravermelho 9𝐵1𝑢 ⊕ 7𝐵2𝑢 ⊕ 9𝐵3𝑢 = 25 IR active modes C) Lattice dynamics - GF Wilson Matrix analysis The lattice dynamic calculations of the normal modes of GCMO were performed with basis on the GF matrix Wilson’s method. In this method, in order to obtain the force constants from the vibrational frequencies, the material has been treated as a system of point masses connected by springs obeying Hooke’s law. Thus, the system can be taken as harmonic and the secular equation is given as |𝐺𝐹 − 𝐸𝜆| = 0 where 𝐹 is a matrix of force constants connected to the vibration potential energies, which arises from the interaction between the atoms and hence provides valuable information about the nature of interatomic forces; 𝐺 is a matrix related to the kinetic energies, which depends on the masses of the individual atoms and their geometrical arrangement; 𝐸 is an unit matrix and 𝜆 is the eigenvalue connected to the frequency through the follow equation 𝑙 = 4𝑝2 𝑐 2 𝑢2 where 𝑐 is the light velocity. To determine the force constant set that gives the best description of the structural and vibrational of GCMO data, we started from reported data of Iliev et al [2]. The initial force constants were modified in order to model the observed phonons. The final force constant values are given in the Table S6. Table S6 - Interatomic force constant values obtained in this work. No off-diagonal interaction terms were applied. Force constant K1 K2 K3 K4 K5 K6 K7 F1 F2 F3 F4 F5 F6 Between atoms Gd -O (1) Gd -O (1) Gd -O (2) Gd -O (2) Co/Mn - O (1) Co/Mn - O (2) Co/Mn - O (2) O(1) - O(2) O(1) - O(2) O(1) - O(2) O(1) - O(2) O(2) - O(2) O(2) - O(2) Distance (Å) 2.2814 2.3403 2.3362 2.5313 1.9658 1.9835 2.0235 2.7654 2.7821 2.8032 2.8759 2.8091 2.8577 Force constant values (N/cm) 1.261 0.886 0.733 0.465 0.412 0.185 0.210 0.445 0.198 0.221 0.494 0.524 0.667 D) Atomic motions in the Raman-active modes Next figures show the atomic motion in each observed Raman-active phonons. (a) (b) Calculated at 624 and 334 cm-1. Figure S1 - (a) In-phase and (b) out-of-phase (Mn/Co)O6 octahedral stretching modes. The motions of Gd and O1 atoms are restricted by the site symmetry (𝑪𝒙𝒛 𝑺 ) within the xz plane for the Ag and B2g modes, and along the y axis for the B1g and B3g modes. (a) (b) Calculated at 494 and 381 cm-1. Figure S2 – (a) Out-of-phase octahedral bendings and (b) O2 antistretching with the Ag symetries. (a) (b) Calculated at 540 and 463.1 cm-1. Figure S3 – (a) In-phase octahedral bendings with the B2g symetries. (b) Out-of-phase bending with Ag symetries and O1 along the x axis. Calculated at 439.5 cm-1. Figure S4 – Out-of-phase octahedra tilt along the x axes bendings with the B2g symmetries. Calculated at 295.6 and 255.6 cm-1. Figure S5 - In-phase octahedra tilt along the b axes with the Ag symetries. In this phonon the RE and O1 ions also moves in the plane xz In-phase Calculated at 277.9 cm-1 Figure S6 – Octahedra out-of-phase rotation along the b axes, whose symmetry is B1g. In this phonon RE and O1 ions moves along the b axes.
