File Name Format
advertisement
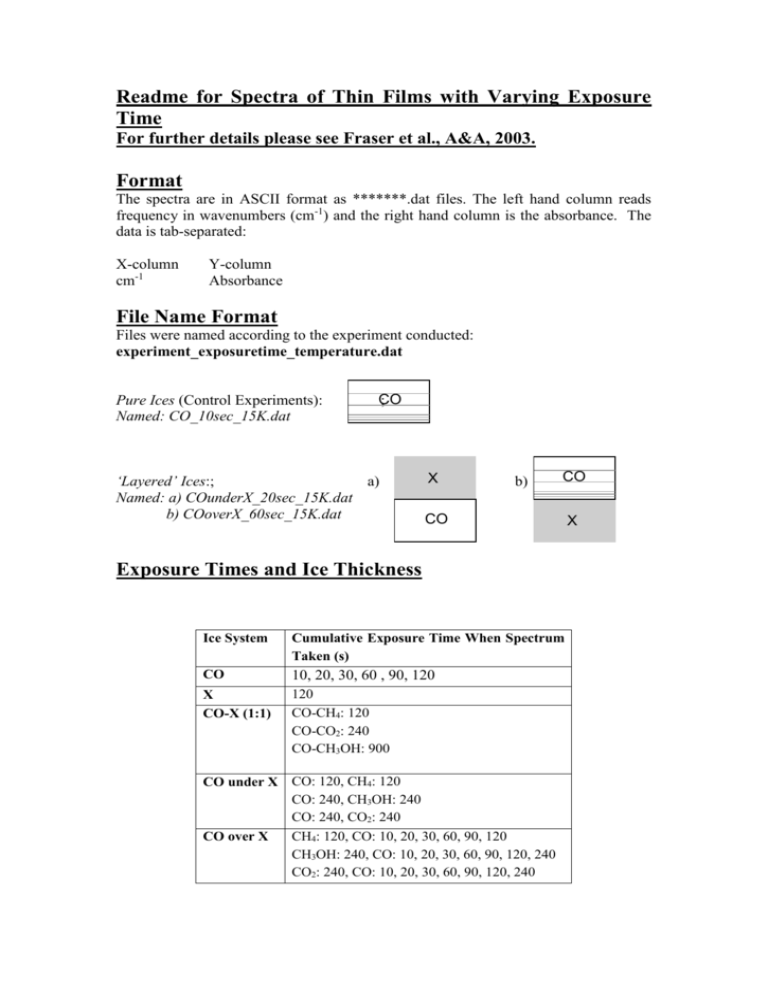
Readme for Spectra of Thin Films with Varying Exposure Time For further details please see Fraser et al., A&A, 2003. Format The spectra are in ASCII format as *******.dat files. The left hand column reads frequency in wavenumbers (cm-1) and the right hand column is the absorbance. The data is tab-separated: X-column cm-1 Y-column Absorbance File Name Format Files were named according to the experiment conducted: experiment_exposuretime_temperature.dat Pure Ices (Control Experiments): Named: CO_10sec_15K.dat CO ; ‘Layered’ Ices:; a) Named: a) COunderX_20sec_15K.dat b) COoverX_60sec_15K.dat X b) CO CO Exposure Times and Ice Thickness Ice System Cumulative Exposure Time When Spectrum Taken (s) CO 10, 20, 30, 60 , 90, 120 X CO-X (1:1) 120 CO-CH4: 120 CO-CO2: 240 CO-CH3OH: 900 CO under X CO: 120, CH4: 120 CO: 240, CH3OH: 240 CO: 240, CO2: 240 CH4: 120, CO: 10, 20, 30, 60, 90, 120 CO over X CH3OH: 240, CO: 10, 20, 30, 60, 90, 120, 240 CO2: 240, CO: 10, 20, 30, 60, 90, 120, 240 X Ices were grown using background filling of the chamber at 1 x 10⁻⁵ torr. This is approximately equivalent to an exposure 10 monolayer s-1. Assuming 1 monolayer is 2 – 5 Å, and uniform ice thickness, approximate ice thicknesses are: Exposure Time (s) Approx. (μm) 10 20 30 60 90 120 240 900 0.0350 0.0700 0.105 0.210 0.315 0.420 0.840 3.15 Ice Thickness FTIR Settings Parameter Y-axis Maximum Y-axis Minimum Detector Scan Speed Delay Aperture Sample Beam Resolution Collect Sensitivity Zero Filling Factor Spectrum Type Under-Sampling Ratio No. of Scans Low Pass Filter Setting 4000 cm-1 400 cm-1 Internal Signal 5 kHz 1.0 s For 0.5 cm-1 Not Installed 0.5 cm-1 8 4 Absorbance 2 128 1.12 kHz
