2.6
advertisement

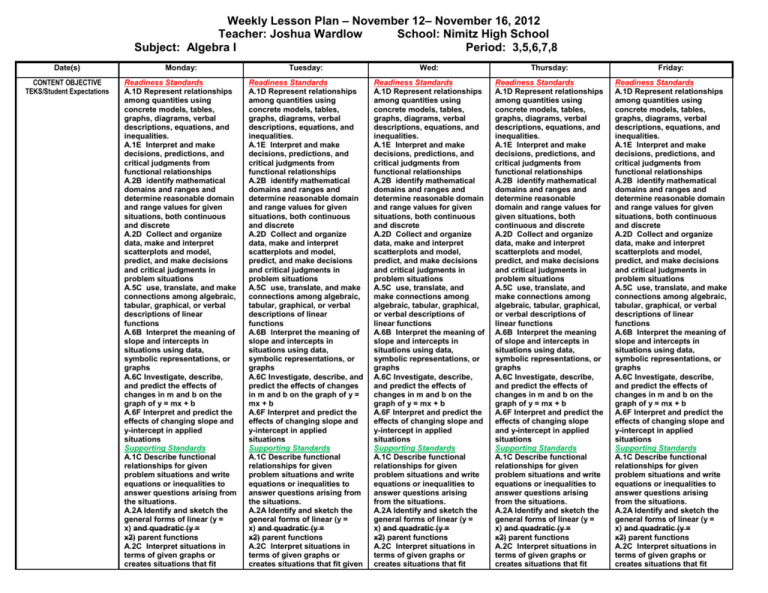
Weekly Lesson Plan – November 12– November 16, 2012 Teacher: Joshua Wardlow School: Nimitz High School Subject: Algebra I Period: 3,5,6,7,8 Date(s) Monday: Tuesday: Wed: Thursday: Friday: CONTENT OBJECTIVE TEKS/Student Expectations Readiness Standards A.1D Represent relationships among quantities using concrete models, tables, graphs, diagrams, verbal descriptions, equations, and inequalities. A.1E Interpret and make decisions, predictions, and critical judgments from functional relationships A.2B identify mathematical domains and ranges and determine reasonable domain and range values for given situations, both continuous and discrete A.2D Collect and organize data, make and interpret scatterplots and model, predict, and make decisions and critical judgments in problem situations A.5C use, translate, and make connections among algebraic, tabular, graphical, or verbal descriptions of linear functions A.6B Interpret the meaning of slope and intercepts in situations using data, symbolic representations, or graphs A.6C Investigate, describe, and predict the effects of changes in m and b on the graph of y = mx + b A.6F Interpret and predict the effects of changing slope and y-intercept in applied situations Supporting Standards A.1C Describe functional relationships for given problem situations and write equations or inequalities to answer questions arising from the situations. A.2A Identify and sketch the general forms of linear (y = x) and quadratic (y = x2) parent functions A.2C Interpret situations in terms of given graphs or creates situations that fit Readiness Standards A.1D Represent relationships among quantities using concrete models, tables, graphs, diagrams, verbal descriptions, equations, and inequalities. A.1E Interpret and make decisions, predictions, and critical judgments from functional relationships A.2B identify mathematical domains and ranges and determine reasonable domain and range values for given situations, both continuous and discrete A.2D Collect and organize data, make and interpret scatterplots and model, predict, and make decisions and critical judgments in problem situations A.5C use, translate, and make connections among algebraic, tabular, graphical, or verbal descriptions of linear functions A.6B Interpret the meaning of slope and intercepts in situations using data, symbolic representations, or graphs A.6C Investigate, describe, and predict the effects of changes in m and b on the graph of y = mx + b A.6F Interpret and predict the effects of changing slope and y-intercept in applied situations Supporting Standards A.1C Describe functional relationships for given problem situations and write equations or inequalities to answer questions arising from the situations. A.2A Identify and sketch the general forms of linear (y = x) and quadratic (y = x2) parent functions A.2C Interpret situations in terms of given graphs or creates situations that fit given Readiness Standards A.1D Represent relationships among quantities using concrete models, tables, graphs, diagrams, verbal descriptions, equations, and inequalities. A.1E Interpret and make decisions, predictions, and critical judgments from functional relationships A.2B identify mathematical domains and ranges and determine reasonable domain and range values for given situations, both continuous and discrete A.2D Collect and organize data, make and interpret scatterplots and model, predict, and make decisions and critical judgments in problem situations A.5C use, translate, and make connections among algebraic, tabular, graphical, or verbal descriptions of linear functions A.6B Interpret the meaning of slope and intercepts in situations using data, symbolic representations, or graphs A.6C Investigate, describe, and predict the effects of changes in m and b on the graph of y = mx + b A.6F Interpret and predict the effects of changing slope and y-intercept in applied situations Supporting Standards A.1C Describe functional relationships for given problem situations and write equations or inequalities to answer questions arising from the situations. A.2A Identify and sketch the general forms of linear (y = x) and quadratic (y = x2) parent functions A.2C Interpret situations in terms of given graphs or creates situations that fit Readiness Standards A.1D Represent relationships among quantities using concrete models, tables, graphs, diagrams, verbal descriptions, equations, and inequalities. A.1E Interpret and make decisions, predictions, and critical judgments from functional relationships A.2B identify mathematical domains and ranges and determine reasonable domain and range values for given situations, both continuous and discrete A.2D Collect and organize data, make and interpret scatterplots and model, predict, and make decisions and critical judgments in problem situations A.5C use, translate, and make connections among algebraic, tabular, graphical, or verbal descriptions of linear functions A.6B Interpret the meaning of slope and intercepts in situations using data, symbolic representations, or graphs A.6C Investigate, describe, and predict the effects of changes in m and b on the graph of y = mx + b A.6F Interpret and predict the effects of changing slope and y-intercept in applied situations Supporting Standards A.1C Describe functional relationships for given problem situations and write equations or inequalities to answer questions arising from the situations. A.2A Identify and sketch the general forms of linear (y = x) and quadratic (y = x2) parent functions A.2C Interpret situations in terms of given graphs or creates situations that fit Readiness Standards A.1D Represent relationships among quantities using concrete models, tables, graphs, diagrams, verbal descriptions, equations, and inequalities. A.1E Interpret and make decisions, predictions, and critical judgments from functional relationships A.2B identify mathematical domains and ranges and determine reasonable domain and range values for given situations, both continuous and discrete A.2D Collect and organize data, make and interpret scatterplots and model, predict, and make decisions and critical judgments in problem situations A.5C use, translate, and make connections among algebraic, tabular, graphical, or verbal descriptions of linear functions A.6B Interpret the meaning of slope and intercepts in situations using data, symbolic representations, or graphs A.6C Investigate, describe, and predict the effects of changes in m and b on the graph of y = mx + b A.6F Interpret and predict the effects of changing slope and y-intercept in applied situations Supporting Standards A.1C Describe functional relationships for given problem situations and write equations or inequalities to answer questions arising from the situations. A.2A Identify and sketch the general forms of linear (y = x) and quadratic (y = x2) parent functions A.2C Interpret situations in terms of given graphs or creates situations that fit Weekly Lesson Plan – November 12– November 16, 2012 Teacher: Joshua Wardlow School: Nimitz High School Subject: Algebra I Period: 3,5,6,7,8 given graphs A.5A Determine whether or not given situations can be represented by linear functions A.5B Determine the domain and range for linear functions in given situations A.6A Develop the concept of slope as rate of change and determine slopes from graphs, tables, and algebraic representations A.6E Determine the intercepts of the graphs of linear functions and zeros of linear functions from graphs, tables, and algebraic representations A.6G Relate direct variation to linear functions and solve problems involving proportional change graphs A.5A Determine whether or not given situations can be represented by linear functions A.5B Determine the domain and range for linear functions in given situations A.6A Develop the concept of slope as rate of change and determine slopes from graphs, tables, and algebraic representations A.6E Determine the intercepts of the graphs of linear functions and zeros of linear functions from graphs, tables, and algebraic representations A.6G Relate direct variation to linear functions and solve problems involving proportional change given graphs A.5A Determine whether or not given situations can be represented by linear functions A.5B Determine the domain and range for linear functions in given situations A.6A Develop the concept of slope as rate of change and determine slopes from graphs, tables, and algebraic representations A.6E Determine the intercepts of the graphs of linear functions and zeros of linear functions from graphs, tables, and algebraic representations A.6G Relate direct variation to linear functions and solve problems involving proportional change given graphs A.5A Determine whether or not given situations can be represented by linear functions A.5B Determine the domain and range for linear functions in given situations A.6A Develop the concept of slope as rate of change and determine slopes from graphs, tables, and algebraic representations A.6E Determine the intercepts of the graphs of linear functions and zeros of linear functions from graphs, tables, and algebraic representations A.6G Relate direct variation to linear functions and solve problems involving proportional change given graphs A.5A Determine whether or not given situations can be represented by linear functions A.5B Determine the domain and range for linear functions in given situations A.6A Develop the concept of slope as rate of change and determine slopes from graphs, tables, and algebraic representations A.6E Determine the intercepts of the graphs of linear functions and zeros of linear functions from graphs, tables, and algebraic representations A.6G Relate direct variation to linear functions and solve problems involving proportional change Weekly Lesson Plan – November 12– November 16, 2012 Teacher: Joshua Wardlow School: Nimitz High School Subject: Algebra I Period: 3,5,6,7,8 LANGUAGE OBJECTIVE INSTRUCTIONAL CONSIDERATIONS Focus Activity Engage Strategies or Methodologies Direct Teach Guided Practice Independent Practice 1C Use strategic learning techniques such as concept mapping, drawing, memorizing, comparing, contrasting, and reviewing to acquire basic and grade-level vocabulary. 3H Narrate, describe, and explain with increasing specificity and detail as more English is acquired. 5B Write using newly acquired basic vocabulary and contentbased grade-level vocabulary. Explore/Explain Students use the Gizmo: SlopeIntercept Form of a Line and describe changes to the linear parent function caused by changing the parameters of m and b. Students generalize the effects of those parameter changes on the linear parent function. 1C Use strategic learning techniques such as concept mapping, drawing, memorizing, comparing, contrasting, and reviewing to acquire basic and grade-level vocabulary. 3H Narrate, describe, and explain with increasing specificity and detail as more English is acquired. 5B Write using newly acquired basic vocabulary and contentbased grade-level vocabulary. Explore/Explain Students define slope as a rate of change and determine slope from graphs, tables, and algebraic representations. 1C Use strategic learning techniques such as concept mapping, drawing, memorizing, comparing, contrasting, and reviewing to acquire basic and grade-level vocabulary. 3H Narrate, describe, and explain with increasing specificity and detail as more English is acquired. 5B Write using newly acquired basic vocabulary and contentbased grade-level vocabulary. Explore/Explain Students continue to define slope as a rate of change and determine slope from graphs, tables, and algebraic representations. Explain Gizmo: Slope-Intercept Form of a Line Slope Powerpoint Investigating Slope (start) Investigating Slope (finish) Can You See the Slope? Parameter Changes on Linear Parent Function EXTENSION Elaborate ASSESSMENT Evaluate DIFFERENTIATION 1C Use strategic learning techniques such as concept mapping, drawing, memorizing, comparing, contrasting, and reviewing to acquire basic and grade-level vocabulary. 3H Narrate, describe, and explain with increasing specificity and detail as more English is acquired. 5B Write using newly acquired basic vocabulary and contentbased grade-level vocabulary. Teacher Note: Help each class to reset the calculators before using them. Make sure students are entering the linear parent function in y1, entering the new function in y2, and format the window to square. To help students distinguish between the two lines, have students use the thick line option in the graphing calculator for the function in y2. Inquiry-Based Lesson Activities Explore INSTRUCTIONAL RESOURCES AVID Strategies 1C Use strategic learning techniques such as concept mapping, drawing, memorizing, comparing, contrasting, and reviewing to acquire basic and grade-level vocabulary. 3H Narrate, describe, and explain with increasing specificity and detail as more English is acquired. 5B Write using newly acquired basic vocabulary and contentbased grade-level vocabulary. Explore/Explain Students use the graphing calculator and describe changes to the linear parent function caused by changing the parameters of m and b. Students generalize the effects of those parameter changes on the linear parent function. Analyzing Multiple Representations of Linear Functions Project Students complete an analysis of various linear functions by describing their characteristics and comparing them to the parent function. Integrated technology Visual representations and realworld connections Calculator


