Incidence and clinical features of tuberculosis
advertisement
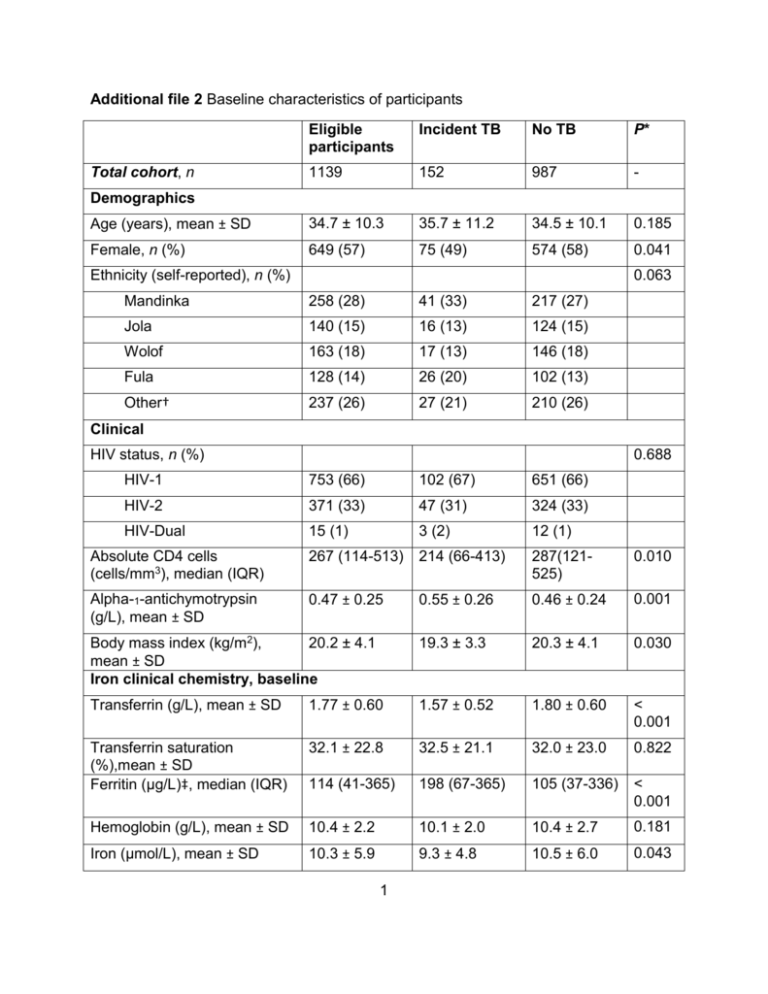
Additional file 2 Baseline characteristics of participants Eligible participants Incident TB No TB P* 1139 152 987 - Age (years), mean ± SD 34.7 ± 10.3 35.7 ± 11.2 34.5 ± 10.1 0.185 Female, n (%) 649 (57) 75 (49) 574 (58) 0.041 Total cohort, n Demographics Ethnicity (self-reported), n (%) 0.063 Mandinka 258 (28) 41 (33) 217 (27) Jola 140 (15) 16 (13) 124 (15) Wolof 163 (18) 17 (13) 146 (18) Fula 128 (14) 26 (20) 102 (13) Other† 237 (26) 27 (21) 210 (26) Clinical HIV status, n (%) 0.688 HIV-1 753 (66) 102 (67) 651 (66) HIV-2 371 (33) 47 (31) 324 (33) HIV-Dual 15 (1) 3 (2) 12 (1) Absolute CD4 cells (cells/mm3), median (IQR) 267 (114-513) 214 (66-413) 287(121525) 0.010 Alpha-1-antichymotrypsin (g/L), mean ± SD 0.47 ± 0.25 0.55 ± 0.26 0.46 ± 0.24 0.001 Body mass index (kg/m2), 20.2 ± 4.1 mean ± SD Iron clinical chemistry, baseline 19.3 ± 3.3 20.3 ± 4.1 0.030 Transferrin (g/L), mean ± SD 1.77 ± 0.60 1.57 ± 0.52 1.80 ± 0.60 < 0.001 Transferrin saturation (%),mean ± SD Ferritin (μg/L)‡, median (IQR) 32.1 ± 22.8 32.5 ± 21.1 32.0 ± 23.0 0.822 114 (41-365) 198 (67-365) 105 (37-336) < 0.001 Hemoglobin (g/L), mean ± SD 10.4 ± 2.2 10.1 ± 2.0 10.4 ± 2.7 0.181 Iron (μmol/L), mean ± SD 10.3 ± 5.9 9.3 ± 4.8 10.5 ± 6.0 0.043 1 Transferrin receptor (nmol/L) ‡, mean ± SD 27.6 ± 16.4 28.4 ± 15.6 27.5 ± 16.5 0.591 Iron-related genes, polymorphisms and genotypes¶ 0.975 Haptoglobin§, n (%) Haptoglobin1-1 302 (33) 34 (34) 268 (33) Haptoglobin 2-1 438 (49) 48 (48) 390 (49) Haptoglobin 2-2 164 (18) 19 (19) 145 (18) SLCA11A1, n (%) SLC1 (rs34448891) 0.681 Allele3/Allele 3 639 (69) 83 (70) 556 (69) Allele 3/Other 260 (28) 31 (26) 229 (28) 4 (3) 18 (2) Other/Other 22 (2) SLC3 (rs3731865) 0.337 G/G 701 (82) 81 (79) 620 (83) C/G 143 (17) 19 (19) 124 (17) C/C 7 (1) 2 (2) 5 (1) SLC6a (rs17235409) 0.620 G/G 744 (87) 88 (86) 656 (87) A/G 107 (12) 14 (14) 93 (12) A/A 6 (1) 0 (0) 6 (1) SLC6b (rs17235416) 0.748 TGTG +/+ 501 (68) 76 (71) 577 (68) TGTG +/- 213 (28) 27 (25) 240 (29) TGTG -/- 26 (4) 4 (4) 30 (4) CAAA (rs17229009) 0.568 CAAA -/- 222 (30) 23 (26) 199 (30) +/- 346 (46) 42 (47) 304 (46) +/+ 181 (24) 25 (28) 156 (24) *For normally-distributed variables, data are presented as mean ± standard deviation, and statistical significance evaluated using Student’s t-test.; for continuous variables that were not normally-distributed, data are presented as the median and interquartile range, and statistical significance evaluated on natural-logarithm transformed data using the Student’s t-test; for categorical variables, data are presented as the frequency and percent, and statistical significance tested using the χ2-test. All tests of significance evaluated the association between participants that did not develop TB against those that did develop incident TB during the study follow-up period. †Other self-reported ethnicity = Combined Manjango, Serer, Serahuli, Aku. ‡Ferritin concentrations < 2.5 μg/L were imputed with a value of 2.5 μg/L; concentrations >1000 μg/L were imputed with a value of 1000 μg/L; sTfR concentrations < 3 nmol/L were imputed with a value of 3 nmol/L; concentrations >80 were imputed with a value of 80 nmol/L. §Based on the actual Haptoglobin allelic variants measured (Hp1F, Hp1S, Hp2FS) which were then expressed as phenotypes for statistical purposes. SLC1 (rs34448891) allele 3 refers to the most common microsatellite allele, referred to as allele 199 in (8). ¶Hardy-Weinberg equilibrium test on the total cohort genotype frequencies: P > 0.05 = Haptoglobin, SLC1, SLC3, SLC6a, SLC6b; P < 0.01 = CAAA. SD, standard deviation; TB = tuberculosis (all forms). 3

