Table 1. Characteristics of the study participants (n=1007) Men (n
advertisement
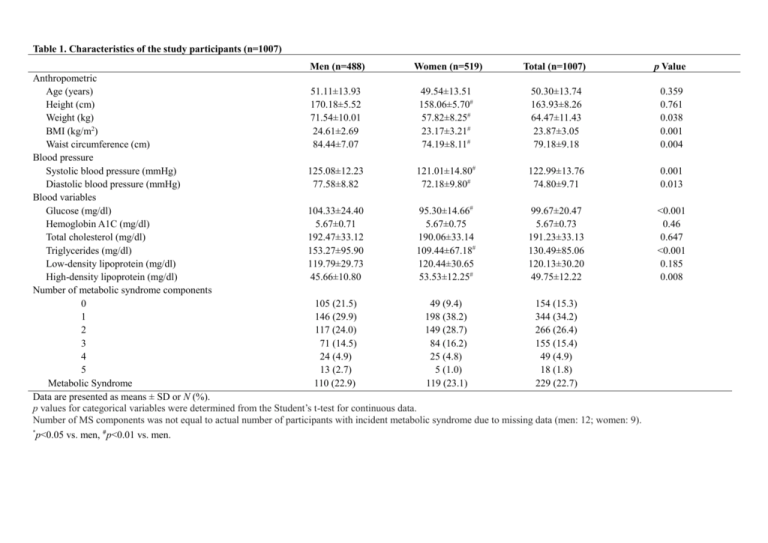
Table 1. Characteristics of the study participants (n=1007) Men (n=488) Women (n=519) Total (n=1007) Anthropometric Age (years) 51.11±13.93 49.54±13.51 50.30±13.74 # Height (cm) 170.18±5.52 158.06±5.70 163.93±8.26 # Weight (kg) 71.54±10.01 57.82±8.25 64.47±11.43 BMI (kg/m2) 24.61±2.69 23.17±3.21# 23.87±3.05 # Waist circumference (cm) 84.44±7.07 74.19±8.11 79.18±9.18 Blood pressure Systolic blood pressure (mmHg) 125.08±12.23 121.01±14.80# 122.99±13.76 # Diastolic blood pressure (mmHg) 77.58±8.82 72.18±9.80 74.80±9.71 Blood variables Glucose (mg/dl) 104.33±24.40 95.30±14.66# 99.67±20.47 Hemoglobin A1C (mg/dl) 5.67±0.71 5.67±0.75 5.67±0.73 Total cholesterol (mg/dl) 192.47±33.12 190.06±33.14 191.23±33.13 Triglycerides (mg/dl) 153.27±95.90 109.44±67.18# 130.49±85.06 Low-density lipoprotein (mg/dl) 119.79±29.73 120.44±30.65 120.13±30.20 High-density lipoprotein (mg/dl) 45.66±10.80 53.53±12.25# 49.75±12.22 Number of metabolic syndrome components 0 105 (21.5) 49 (9.4) 154 (15.3) 1 146 (29.9) 198 (38.2) 344 (34.2) 2 117 (24.0) 149 (28.7) 266 (26.4) 3 71 (14.5) 84 (16.2) 155 (15.4) 4 24 (4.9) 25 (4.8) 49 (4.9) 5 13 (2.7) 5 (1.0) 18 (1.8) Metabolic Syndrome 110 (22.9) 119 (23.1) 229 (22.7) Data are presented as means ± SD or N (%). p values for categorical variables were determined from the Student’s t-test for continuous data. Number of MS components was not equal to actual number of participants with incident metabolic syndrome due to missing data (men: 12; women: 9). * p<0.05 vs. men, #p<0.01 vs. men. p Value 0.359 0.761 0.038 0.001 0.004 0.001 0.013 <0.001 0.46 0.647 <0.001 0.185 0.008 Table 2. Anthropometric and exercise characteristics of men (488) and women (519) according to tertile of BMI Men (n=488) Women (n=519) Low BMI (17.1 – 23.6 kg/m2) Middle BMI (23.7 – 25.7 kg/m2) High BMI (25.8 - 34 kg/m2) 162 166 160 Age (years) 51.06±15.49 51.02±13.34 51.24±12.94 Height (cm) 170.48±5.41 170.25±5.66 Weight (kg) 63.13±6.23 71.76±4.66* 21.69±1.54 24.74±0.60 * 77.84±5.29 85.07±3.99 * 121.48±13.04 124.95±10.44 No. of participants Anthropometric BMI (kg/m2) Waist circumference (cm) Low BMI (15.9 – 21.4 kg/m2) Middle BMI (21.5 – 24 kg/m2) High BMI (24.1 – 35.6 kg/m2) 169 179 171 0.989 44.24±12.90 49.21±13.23 55.13±12.22 < 0.001 169.79±5.50 0.524 158.70±5.27 157.74±5.12 157.97±5.29 0.215 79.82±10.19*# < 0.001 50.41±5.47 56.50±5.32* 66.64±5.49*# < 0.001 20.05±1.65 22.69±1.61 * 26.73±1.67 *# < 0.001 * 81.99±4.78 *# < 0.001 27.44±1.61 *# 90.48±5.16 *# p Value < 0.001 < 0.001 67.70±4.77 72.89±4.64 < 0.001 116.78±12.94 119.85±12.57 p Value Blood pressure Systolic blood pressure (mmHg) Diastolic blood pressure (mmHg) 74.75±9.18 77.90±8.07 103.98±31.10 102.96±20.94 128.87±12.03*# 80.10±8.41 *# < 0.001 70.09±9.32 71.74±9.06 0.502 92.07±14.66 96.34±14.25* 125.75±12.99*# 74.38±9.35 *# < 0.001 < 0.001 Blood variables Glucose (mg/dl) 106.09±19.58 97.38±4.71* 0.003 # Hemoglobin A1C (mg/dl) 5.67±0.81 5.68±0.63 5.67±0.68 0.990 5.70±0.76 5.76±0.75 5.55±0.78 Total cholesterol (mg/dl) 192.21±23.17 194.51±34.51 190.60±32.68 0.563 190.79±34.22 190.01±33.27 189.76±34.34 Triglycerides (mg/dl) 127.91±86.02 145.01±75.52 187.15±133.32 Low-density lipoprotein (mg/dl) 118.96±28.75 122.89±31.55 117.34±28.62 * *# 49.15±12.33 45.19±10.60 42.65±8.11 * *# < 0.001 96.49±64.19 104.67±62.43 0.230 120.15±31.59 122.40±30.72 119.02±31.70 * 50.24±12.24* < 0.001 57.43±12.20 53.26±11.87 124.59±64.42 0.034 0.961 < 0.001 0.586 < 0.001 High-density lipoprotein (mg/dl) No. of participants with incident MS 14 (8.9) 30 (18.4) 66 (41.5)*# < 0.001 17 (10.1) 31 (17.6) 71 (41.5) *# < 0.001 Data are presented as means ± SD or N (%). All men and women participants were divided into three groups according to tertile of Body Mass Index, respectively. One-way ANOVA was used to compare means of parameters between three groups in men. Post-hoc analysis: Scheffe. Analysis of Covariance (ANCOVA) was used to compare means of parameters between three groups after age controlled for women. Post-hoc analysis: Bonferroni. * : significantly different between low BMI and middle BMI or significantly different between low BMI and high BMI, p<0.05, 1#: significantly different between middle BMI and high BMI, p<0.05. Abbreviations: BMI, Body Mass Index; CRF, Cardiorespiratory fitness. Table 3. Anthropometric and exercise characteristics of men (488) and women (519) according to tertile of heart rate recovery Men (n=488) No. of participants Women (n=519) High CRF (53 – 82 bpm) 163 Moderate CRF (83 – 93 bpm) 162 Low CRF (94 – 137 bpm) 163 p Value High CRF (65 – 86 bpm) 176 Moderate CRF (87 – 97 bpm) 169 Low CRF (98 – 133 bpm) 174 p Value 52.56±14.04 51.49±13.70 49.26±13.95 0.092 54.74±12.95 48.31±13.45* 45.48±12.46* < 0.001 158.15±8.54 158.14±5.17 158.11±8.90 1.000 Anthropometric Age (years) Height (cm) 169.62±5.50 170.16±5.50 170.75±5.54 0.182 Weight (kg) 70.29±8.54 72.53±11.82 71.54±9.31 0.121 56.42±13.68 57.86±8.29 59.18±14.27 0.377 BMI (kg/m2) 24.41±2.50 24.82±2.70 24.61±2.85 0.391 22.62±5.05 23.15±3.06 23.62±5.26 0.362 72.71±12.02 74.08±7.28 75.58±12.52 0.242 Waist circumference (cm) 83.45±6.80 84.90±7.02 84.97±7.31 0.089 125.18±12.38 124.07±11.46 125.99±12.80 0.368 119.69±21.63 119.24±13.13 122.73±22.56 0.347 0.026 72.28±15.25 71.13±9.26 73.74±15.91 0.287 Blood pressure Systolic blood pressure (mmHg) Diastolic blood pressure (mmHg) * 76.50±8.93 77.19±8.44 79.05±8.93 100.40±16.53 102.20±20.95 110.36±31.99*# < 0.001 94.17±23.94 94.65±14.51 96.95±24.97 0.601 5.68±0.70 0.982 5.68±1.25 5.61±0.75 5.71±1.29 0.409 182.75±55.09 192.22±33.40 195.47±57.47. 0.136 103.56±105.30 113.94±63.74 107.88±109.82 0.402 125.15±53.01 0.061 Blood variables Glucose (mg/dl) Hemoglobin A1C (mg/dl) 5.67±0.68 5.66±0.75 Total cholesterol (mg/dl) 192.33±33.54 192.99±32.85 192.08±33.16 0.968 Triglycerides (mg/dl) 140.04±85.72 162.97±109.63 158.89±89.58 0.086 121.36±29.47 0.492 Low-density lipoprotein (mg/dl) 120.46±29.70 117.53±30.09 * * 0.001 113.03±50.81 123.42±30.81 * High-density lipoprotein (mg/dl) 48.23±13.02 44.25±8.93 44.47±9.58 54.47±20.27 53.67±12.27 52.83±21.14 0.851 * No. of participants with incident MS 26 (23.6) 39 (35.5) 45 (40.9) 0.035 39 (22.4) 37 (21.9) 43 (24.9) 0.392 Data are presented as means ± SD or N (%). All men and women participants were divided into three groups according to tertile of Heart Rate Recovery, respectively. One-way ANOVA was used to compare means of parameters between three groups in men. Post-hoc analysis: Scheffe. Analysis of Covariance (ANCOVA) was used to compare means of parameters between three groups of women after age was controlled for. Post-hoc analysis: Bonferroni. * : significantly different between low CRF and middle CRF or significantly different between low CRF and high CRF; #: significantly different between middle CRH and high CRF. Abbreviations: HRR, Heart rate recovery; CRF, Cardiorespiratory fitness.


