What`s Your Temperature? Learning
advertisement
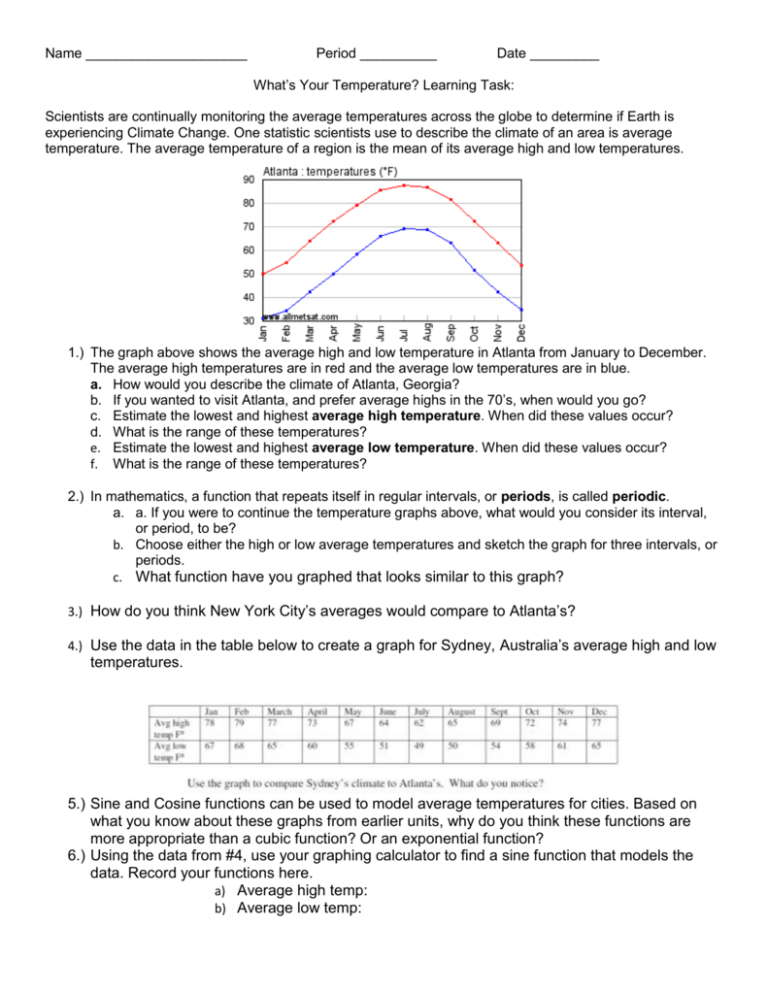
Name _____________________ Period __________ Date _________ What’s Your Temperature? Learning Task: Scientists are continually monitoring the average temperatures across the globe to determine if Earth is experiencing Climate Change. One statistic scientists use to describe the climate of an area is average temperature. The average temperature of a region is the mean of its average high and low temperatures. 1.) The graph above shows the average high and low temperature in Atlanta from January to December. The average high temperatures are in red and the average low temperatures are in blue. a. How would you describe the climate of Atlanta, Georgia? b. If you wanted to visit Atlanta, and prefer average highs in the 70’s, when would you go? c. Estimate the lowest and highest average high temperature. When did these values occur? d. What is the range of these temperatures? e. Estimate the lowest and highest average low temperature. When did these values occur? f. What is the range of these temperatures? 2.) In mathematics, a function that repeats itself in regular intervals, or periods, is called periodic. a. a. If you were to continue the temperature graphs above, what would you consider its interval, or period, to be? b. Choose either the high or low average temperatures and sketch the graph for three intervals, or periods. c. What function have you graphed that looks similar to this graph? 3.) How do you think New York City’s averages would compare to Atlanta’s? 4.) Use the data in the table below to create a graph for Sydney, Australia’s average high and low temperatures. 5.) Sine and Cosine functions can be used to model average temperatures for cities. Based on what you know about these graphs from earlier units, why do you think these functions are more appropriate than a cubic function? Or an exponential function? 6.) Using the data from #4, use your graphing calculator to find a sine function that models the data. Record your functions here. a) Average high temp: b) Average low temp: http://www.regentsprep.org/regents/math/algtrig/ATT7/graphpractice3.htm For answers!

