global weather IA
advertisement
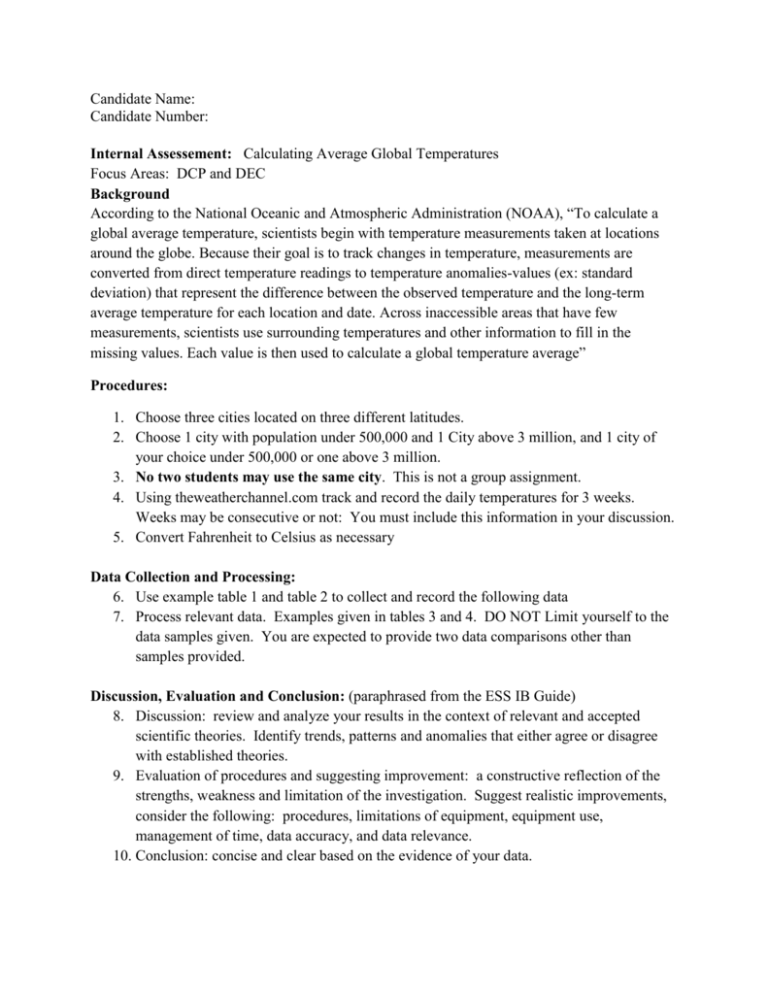
Candidate Name: Candidate Number: Internal Assessement: Calculating Average Global Temperatures Focus Areas: DCP and DEC Background According to the National Oceanic and Atmospheric Administration (NOAA), “To calculate a global average temperature, scientists begin with temperature measurements taken at locations around the globe. Because their goal is to track changes in temperature, measurements are converted from direct temperature readings to temperature anomalies-values (ex: standard deviation) that represent the difference between the observed temperature and the long-term average temperature for each location and date. Across inaccessible areas that have few measurements, scientists use surrounding temperatures and other information to fill in the missing values. Each value is then used to calculate a global temperature average” Procedures: 1. Choose three cities located on three different latitudes. 2. Choose 1 city with population under 500,000 and 1 City above 3 million, and 1 city of your choice under 500,000 or one above 3 million. 3. No two students may use the same city. This is not a group assignment. 4. Using theweatherchannel.com track and record the daily temperatures for 3 weeks. Weeks may be consecutive or not: You must include this information in your discussion. 5. Convert Fahrenheit to Celsius as necessary Data Collection and Processing: 6. Use example table 1 and table 2 to collect and record the following data 7. Process relevant data. Examples given in tables 3 and 4. DO NOT Limit yourself to the data samples given. You are expected to provide two data comparisons other than samples provided. Discussion, Evaluation and Conclusion: (paraphrased from the ESS IB Guide) 8. Discussion: review and analyze your results in the context of relevant and accepted scientific theories. Identify trends, patterns and anomalies that either agree or disagree with established theories. 9. Evaluation of procedures and suggesting improvement: a constructive reflection of the strengths, weakness and limitation of the investigation. Suggest realistic improvements, consider the following: procedures, limitations of equipment, equipment use, management of time, data accuracy, and data relevance. 10. Conclusion: concise and clear based on the evidence of your data. Data Collection Examples City: Portland, Oregon 15° *All temperatures rounded to nearest whole number 5/13/14 5/14/14 5/15/14 5/16/14 5/17/14 Average Daily Temp Standard Deviation Differenc e month average vs. day average Differenc e low monthly vs low day Differenc e high monthly vs high day Average 9° Low 20° C Population: 583,776 High Average temp Average Low Average m high Month May Latitude: 45.5 N Date 29 32 30 24 18 27 13 15 12 11 10 12 21 24 21 18 14 19 5.6 1.9 3.7 9 12 10 4 8 4 6 3 2 1 6 9 6 3 1 9 3 5 2.9 1.9 3.0 Example Table 1 City: Portland, Oregon Latitude: 45.5 N Population: 583,776 Normal temperature fluctuation Normal temperature fluctuation Normal temperature fluctuations for Monthly High for week of for Monthly Low for average 5/13- 5/17 for week of 5/13- 5/17 for week of 5/13- 5/17 21˚ to 33˚ 10˚ to 14˚ 15˚ to 23˚ Example Table 2 Processed Data Examples Table 3 Current Daily Temperatures Vs. Monthly High/Low Tempertures for May Temperature 20 Current Daily Temperature in Celsius 15 10 Average High 5 0 13-May 14-May 15-May 16-May May 13-17, 2014 Table 4 17-May Average Low
