fwb12333-sup-0002-AppendixS1-S2
advertisement
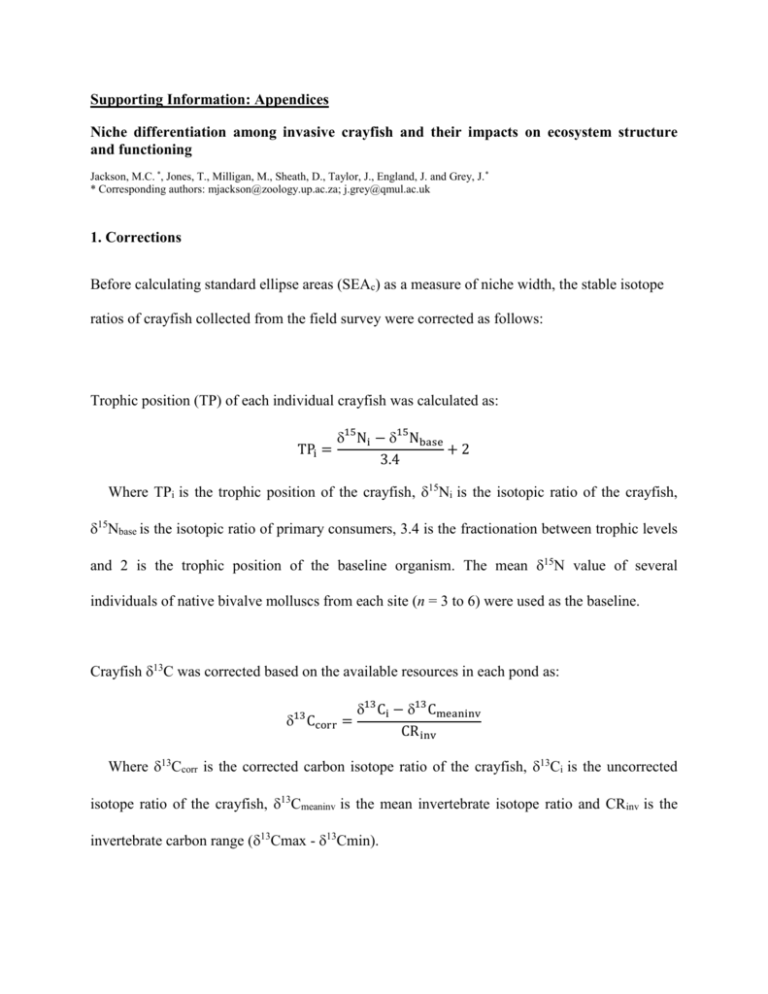
Supporting Information: Appendices Niche differentiation among invasive crayfish and their impacts on ecosystem structure and functioning Jackson, M.C. *, Jones, T., Milligan, M., Sheath, D., Taylor, J., England, J. and Grey, J. * * Corresponding authors: mjackson@zoology.up.ac.za; j.grey@qmul.ac.uk 1. Corrections Before calculating standard ellipse areas (SEAc) as a measure of niche width, the stable isotope ratios of crayfish collected from the field survey were corrected as follows: Trophic position (TP) of each individual crayfish was calculated as: 15 Ni − 15 Nbase TPi = +2 3.4 Where TPi is the trophic position of the crayfish, 15Ni is the isotopic ratio of the crayfish, 15Nbase is the isotopic ratio of primary consumers, 3.4 is the fractionation between trophic levels and 2 is the trophic position of the baseline organism. The mean 15N value of several individuals of native bivalve molluscs from each site (n = 3 to 6) were used as the baseline. Crayfish 13C was corrected based on the available resources in each pond as: 13 Ccorr = 13 Ci − 13 Cmeaninv CR inv Where 13Ccorr is the corrected carbon isotope ratio of the crayfish, 13Ci is the uncorrected isotope ratio of the crayfish, 13Cmeaninv is the mean invertebrate isotope ratio and CRinv is the invertebrate carbon range (13Cmax - 13Cmin). 2. Isotopic turnover Individuals used in the mesocosm experiments were collected at the same time, and from the same sites, as those collected for the field survey in 2010. The stable isotope ratios of individuals used for the field survey in 2010 differed significantly (in 15N, 13C, or both; significance level P < 0.1) from those used in the mesocosm experiment following experiment completion (Table S1). This indicates that the duration of the experiment was long enough for the muscle tissue of crayfish to start reflecting their diet under experimental conditions in the mesocosms. Furthermore, the trajectory of isotopic change in each species between the field survey and experiment completion varied (Figure S6) and each crayfish experimental pair (signal and virile; red swamp and Turkish) shifted in different directions. Table S1. Results of ANOVA testing for differences in crayfish species 13C and 15N between field and experiment populations in 2010. df. F P 13C: Signal Virile Red Swamp Turkish 1,55 1,49 1,48 1,50 497.60 9.91 4.16 3.29 < 0.001 0.003 0.047 0.076 15N: Signal Virile Red Swamp Turkish 1,55 1,49 1,48 1,50 37.42 2.05 1.80 0.01 < 0.001 0.158 0.186 0.909 Figure S6. Bi-plot showing the isotope signatures (mean ± standard error) of signal (yellow), virile (green), red swamp (red) and Turkish (blue) crayfish, sampled at the same time and from the same sites, following capture (circles) and experiment completion (triangles). Arrows show the mean direction and magnitude of change. 18 15 N (‰) 16 14 12 10 8 -34 -33 -32 -31 -30 13C (‰) -29 -28 -27 -26
