Chromatography Notes
advertisement
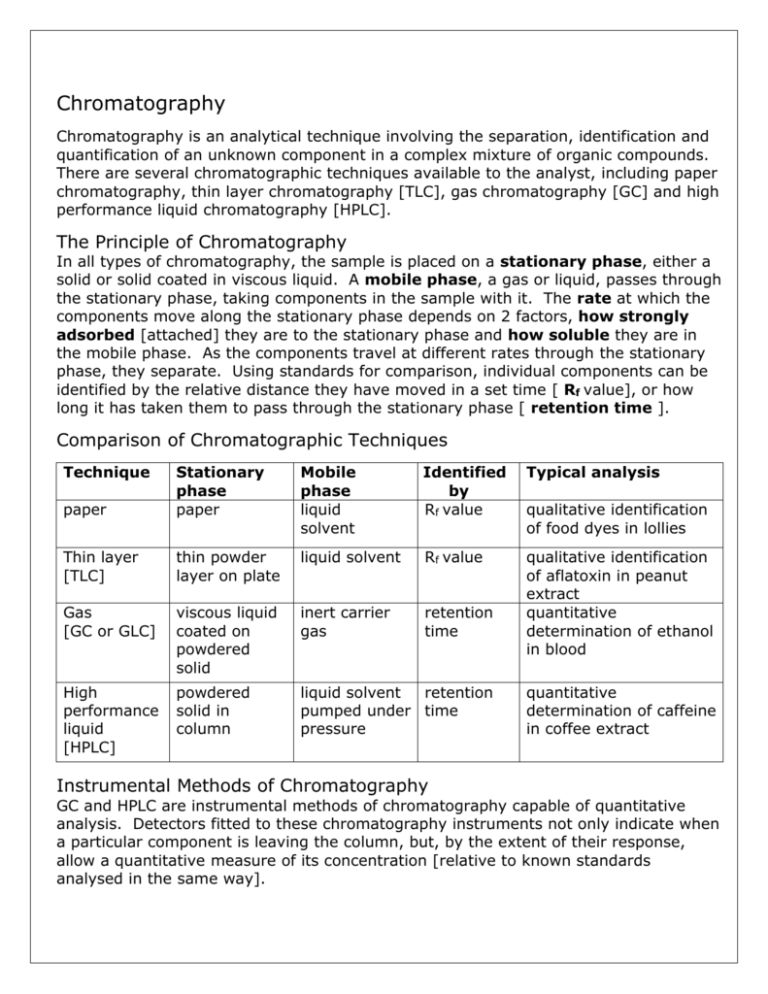
Chromatography Chromatography is an analytical technique involving the separation, identification and quantification of an unknown component in a complex mixture of organic compounds. There are several chromatographic techniques available to the analyst, including paper chromatography, thin layer chromatography [TLC], gas chromatography [GC] and high performance liquid chromatography [HPLC]. The Principle of Chromatography In all types of chromatography, the sample is placed on a stationary phase, either a solid or solid coated in viscous liquid. A mobile phase, a gas or liquid, passes through the stationary phase, taking components in the sample with it. The rate at which the components move along the stationary phase depends on 2 factors, how strongly adsorbed [attached] they are to the stationary phase and how soluble they are in the mobile phase. As the components travel at different rates through the stationary phase, they separate. Using standards for comparison, individual components can be identified by the relative distance they have moved in a set time [ Rf value], or how long it has taken them to pass through the stationary phase [ retention time ]. Comparison of Chromatographic Techniques Technique Mobile phase liquid solvent Identified by Rf value Typical analysis paper Stationary phase paper Thin layer [TLC] thin powder layer on plate liquid solvent Rf value Gas [GC or GLC] viscous liquid coated on powdered solid inert carrier gas retention time qualitative identification of aflatoxin in peanut extract quantitative determination of ethanol in blood High performance liquid [HPLC] powdered solid in column liquid solvent retention pumped under time pressure qualitative identification of food dyes in lollies quantitative determination of caffeine in coffee extract Instrumental Methods of Chromatography GC and HPLC are instrumental methods of chromatography capable of quantitative analysis. Detectors fitted to these chromatography instruments not only indicate when a particular component is leaving the column, but, by the extent of their response, allow a quantitative measure of its concentration [relative to known standards analysed in the same way]. Thin Layer Chromatography In thin later chromatography [TLC] the stationary phase is a layer of fine powder [usually silica gel or aluminium oxide] attached to a glass, aluminium or plastic plate. The mobile phase is usually a mixture of organic solvents. The sample is spotted onto the bottom of the plate, just above the solvent line. The solvent is drawn up the plate, dissolving and moving the components in the sample mixture. The components in the sample mixture move at different speeds up the plate, thus separating. The speed that a particular component moves at is determined by its solubility in the solvent and, more importantly, how strongly attracted to [adsorbed onto] the stationary phase it is. The polar stationary phase will attract polar components in the mixture more strongly and they will be the slower components. Non-polar components will not be as attracted to the stationary phase and will travel faster up the plate. The distance travelled by a component as a ratio to the distance travelled by the solvent is called the Rf value and is used to identify the component. Rf = dc/ds … dc = component distance; ds = solvent distance ------------------------------------------------------------------------Instrumental Methods of Chromatography Gas Chromatography [GC or GLC] GC is an instrumental chromatography technique capable of separating, identifying and estimating the amount of an organic compound found in a complex mixture. The component to be analysed should be volatile or able to be vaporized without degradation, so GC is generally suitable for organic molecules with molar masses up to 300. The stationary phase is a powdered solid coated with a viscous liquid which is packed into a long, thin, coiled tube positioned in an oven to keep the sample gaseous as it passes through. The mobile phase is an inert carrier gas, such as nitrogen. The Gas Chromatograph a sample is injected into the heated sample injector, vaporising the sample the now gaseous sample is swept into and along the column by the inert carrier gas in the column, components in the sample mixture are attracted to and adsorbed onto the stationary phase different components are adsorbed to differing degrees, depending on the strength of their attachment to it … and so travel at different rates through it. components strongly adsorbed progress slowly, components less adsorbed are swept at a faster rate through the column by the carrier gas and emerge first the detector, often a FID [ flame ionisation detector ], not only signals when each component leaves the column, but by the size of its response, allows a quantitative estimate of the amount of the component in the sample to allow identification and quantification of a particular component, standards of it of known concentration are subjected to the same method as the sample a component can be identified by the time it takes it to travel through the column [ retention time ]; the comparative height [ or area ] of the its peak on the recorder chart can be used to determine its concentration ------------------------------------------------------------------------Instrumental Methods of Chromatography High Performance Liquid Chromatography [HPLC] HPLC is an instrumental chromatography technique capable of separating, identifying and estimating the amount of an organic compound found in a complex mixture. HPLC can be used to analyse components with a higher molar mass [up to 1000] that might decompose if subjected to GC. There are two types of stationary phase used in HPLC [normal phase and reverse phase], both a finely powdered solid, which is packed tightly into a column about 200 mm long. The mobile phase is a liquid solvent which is pumped at high pressure through the column. The HPLC Chromatograph a sample is injected onto the start of the chromatography column packed with stationary phase the solvent [mobile phase] is pumped at high pressure through the HPLC tube, carrying the sample mixture along with it in the column, components in the sample mixture are attracted to and adsorbed onto the stationary phase different components are adsorbed to differing degrees, depending on the strength of their attachment to it … and so travel at different rates through it. components strongly adsorbed progress slowly, components less adsorbed are moved along at a faster rate by the pumped solvent and emerge first the detector, often a UV spectrometer, not only signals when each component leaves the column, but by the size of its response, allows a quantitative estimate of the amount of the component in the sample to allow identification and quantification of a particular component, standards of it of known concentration are subjected to the same method as the sample a component can be identified by the time it takes it to travel through the column [retention time]; the comparative height [or area] of the its peak on the display chart can be used to determine its concentration Normal and Reverse Phase HPLC In normal phase HPLC, the stationary phase is polar silica particles, the mobile phase is non-polar. Polar components of the sample will be adsorbed more strongly and be last to leave the column. Non-polar components will not be as attracted to the stationary phase, travel quickly and have lower retention times. In reversed phase HPLC the stationary phase surface has been made nonpolar, having been treated with long chain hydrocarbons. Now, non-polar components are more attracted to the stationary phase and have the longer retention times. Polar components are not as attracted, travel faster and have lower retention times. Reversed phase HPLC is more commonly used in analysis. Example of Thin Layer Chromatography Identification of chlorinated hydrocarbon pesticides in plant crops Plant samples were ground up and extracted with hexane. The extracts were spotted on a TLC plate [ glass plate coated in Silica gel G ]. The plate was developed in a covered chromatography tank using a 9:1 chloroform/hexane solvent. The solvent rose 17.0 cm during the development. After development, the plate was sprayed with a dilute silver nitrate solution to reveal traces of chlorinated hydrocarbon. The TLC Chromatogram ---------------------------------------17.0 cm 14.1 cm 12.0 cm TLC plate: silica gel on glass Solvent: 9:1 chloroform/hexane Standard Rf values for chlorinated hydrocarbons developed by this method … 10.9 cm 3.7 cm 2.6 cm Aldrin [ Rf = 0.83 ] Dieldrin [ Rf = 0.08 ] Endosulfan [ Rf = 0.15 ] Lindane [ Rf = 0.22 ] PCNB [ Rf = 0.71 ] --o------o-------o------- o--------#1 #2 #3 #4 Analysis of Chromatogram Sample distance moved by spot [cm] #1 3.7 #2 #3 #4 Rf value 3.7/17 = 0.218 chlorinated hydrocarbon present in sample Lindane Example of Gas Chromatography [GLC] Determination of toluene in a mixture of organic solvents The concentration of toluene in a complex mixture of organic solvents was found using a Perkin Elmer Gas Chromatograph fitted with a flame ionisation detector [ FID ]. In the analysis, 1.0 L injections of toluene standards and the sample were placed on a coated fused silica GC column maintained at 75oC and subjected to a nitrogen carrier gas flow rate of 60 mL per minute. Chromatograms: injection toluene retention time = 4.6 minutes Standards – peaks recorded at a retention time of 4.6 minutes 15.0% toluene 25% Analysis of Chromatogram Sample height [mm] 15% std. 25% std. 35% std. 45% std. mixture 35% 45% width @ ½ ht. [mm] Peak area [mm2] Example of HPLC Chromatography Determination of 4-butoxybenzoic acid in an organic acid mixture The concentration of 4-butoxybenzoic acid in a liquid sample containing a complex mixture of organic acids can be determined by high performance liquid chromatography. In the analysis, 1.0 L aliquots of the mixture and 4-butoxybenzoic acid standards were injected onto a zirconia-based column. The mobile phase was a 60/40 acetonitrile/water solvent at a column pressure of 6x10³ kPa. Component peaks were detected with a UV detector set at 254 nm and peak areas evaluated automatically. The 4-butoxybenzoic acid standards gave a retention time of 5.8 minutes and the sample peak at this retention time was analysed. Analysis of Chromatogram: injection peak at 5.8 min Substance injected 5.0 mg/L standard 10.0 mg/L standard 15.0 mg/L standard 20.0 mg/L standard 25.0 mg/L standard organic sample Peak area [arbitrary units] 68 137 208 273 339 234

