Activity 2 Coming of Age
advertisement
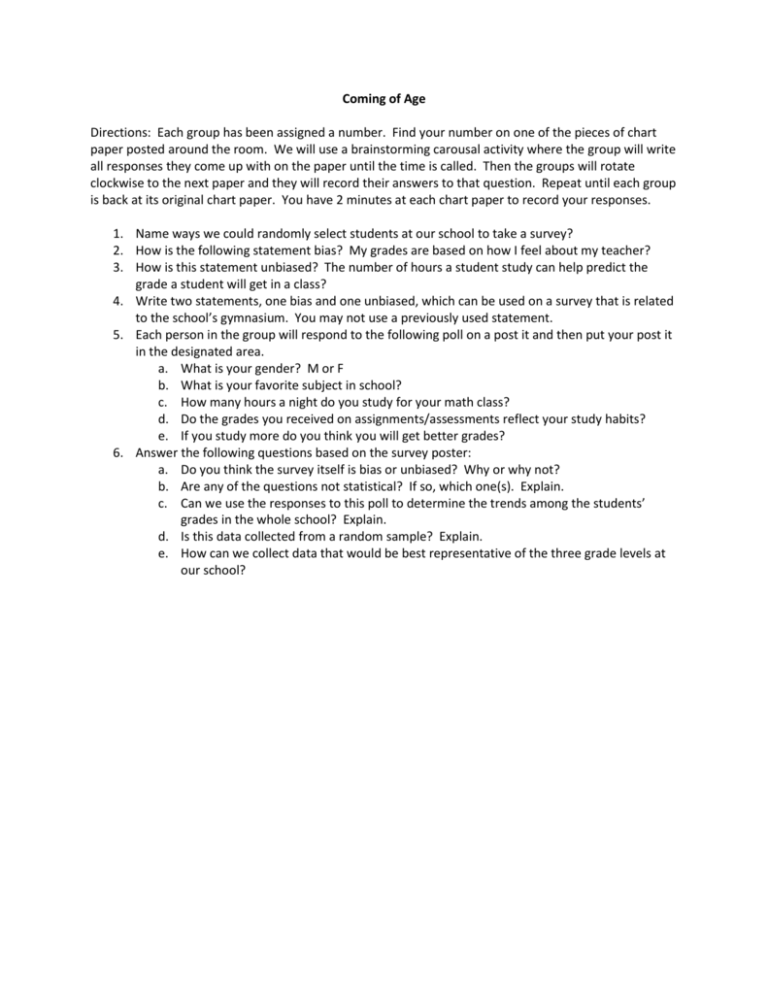
Coming of Age Directions: Each group has been assigned a number. Find your number on one of the pieces of chart paper posted around the room. We will use a brainstorming carousal activity where the group will write all responses they come up with on the paper until the time is called. Then the groups will rotate clockwise to the next paper and they will record their answers to that question. Repeat until each group is back at its original chart paper. You have 2 minutes at each chart paper to record your responses. 1. Name ways we could randomly select students at our school to take a survey? 2. How is the following statement bias? My grades are based on how I feel about my teacher? 3. How is this statement unbiased? The number of hours a student study can help predict the grade a student will get in a class? 4. Write two statements, one bias and one unbiased, which can be used on a survey that is related to the school’s gymnasium. You may not use a previously used statement. 5. Each person in the group will respond to the following poll on a post it and then put your post it in the designated area. a. What is your gender? M or F b. What is your favorite subject in school? c. How many hours a night do you study for your math class? d. Do the grades you received on assignments/assessments reflect your study habits? e. If you study more do you think you will get better grades? 6. Answer the following questions based on the survey poster: a. Do you think the survey itself is bias or unbiased? Why or why not? b. Are any of the questions not statistical? If so, which one(s). Explain. c. Can we use the responses to this poll to determine the trends among the students’ grades in the whole school? Explain. d. Is this data collected from a random sample? Explain. e. How can we collect data that would be best representative of the three grade levels at our school? Teacher Notes Activity #2 – Coming of Age Teacher Notes: This activity should be given while doing/after notes/lectures. Checking for understanding. Have 5 chart papers posted around the room. Each chart paper will have a different statement. You will put the class in groups of 4. Each group is assigned a number related to the number on the chart paper. That is where each group starts. We will use a brainstorming carousal activity where is group will write all responses they come up with on the paper until the time is called. Then the groups will rotate clockwise to the next paper and they will record their answers to that question. Repeat until each group is back at its original chart paper. Give each location up to 2 minutes. 1. How could we randomly select students at our school to take a survey? Sample answer: Put the student numbers in a number generator and have the program select the students randomly; assign each student a number/color and then have the random generator select students. 2. How is the following statement bias? My grades are based on how I feel about my teacher? Sample answer: Since I like this teacher I want to get a good grade in his/her class. The teacher doesn’t like me therefore, I will not do anything in this class to show my interest. 3. How is this statement unbiased? The number of hours a student study can help predict the grade a student will get in a class? Sample answer: Since this number could vary considerably and based on that information you could come up with an average number of hours to determine the outcomes of grades in a class. 4. Take the following poll on a post and then put your post it in the designated area. Answers vary. a. What is your gender? M or F b. What is your favorite subject in school? c. How many hours a night do you study for your math class? d. Do your grades received on assignments/assessments reflect your study habits? e. If you study more do you think you will get better grades? 5. On the previous poster: a. Do you think the survey itself is bias or unbiased? Why or why not? Sample answers biased because most of the questions are open-ended and the questions themselves lead to leading to specific responses based on previous responses. b. Are any of the questions not statistical? If so, which one(s). Explain. Sample answers: (a) is not statistical in its present format. c. Can we use the responses to this poll to determine the trends among the students’ grades in the whole school? Explain. Sample answer: No depending on the number of students in the school this sample would not be consider a good size to represent the population of the school. d. Is this data collected from a random sample? Explain. Sample answer: No – we took all the answers from everyone in this class; if we look at it as a voluntary response sample or convenience sample. e. How can we collect data that would be best representative of the three grade levels at our school? Sample answer: Set up poll workers in the front of the school and survey anyone who has a white uniform shirt, set up booth in the cafeteria during each of the grade level lunches and have students sitting in specific positions at the lunch table to take the survey, select various teachers and have all their students in their classes take the survey.


