Discrete Probability Distribution Problems
advertisement
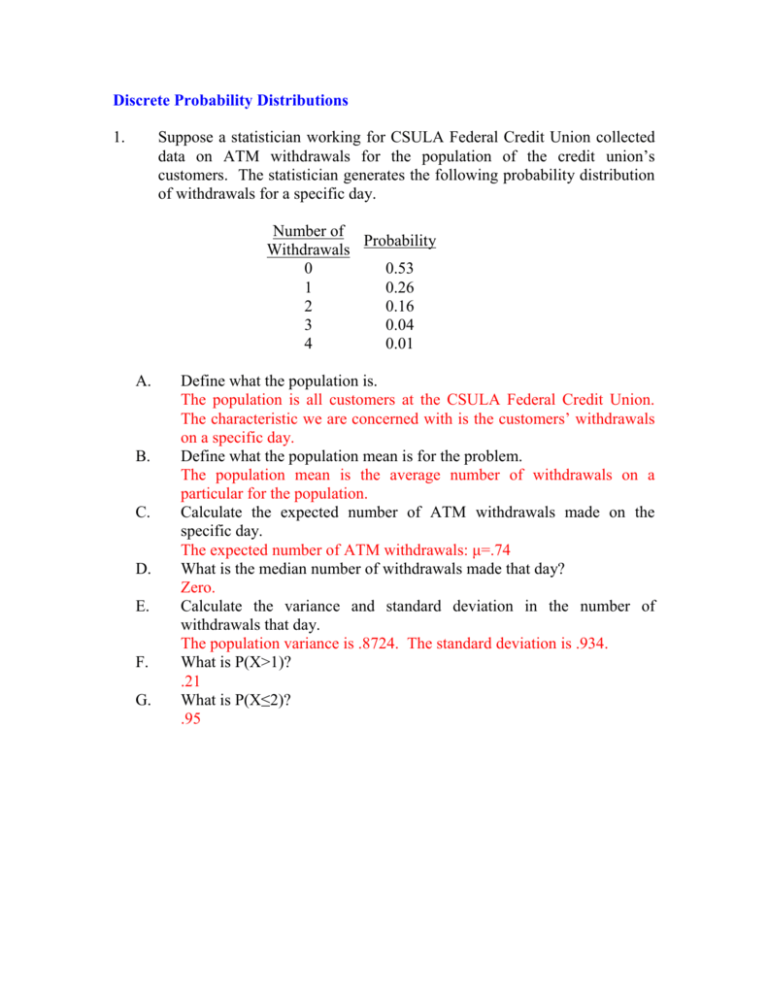
Discrete Probability Distributions 1. Suppose a statistician working for CSULA Federal Credit Union collected data on ATM withdrawals for the population of the credit union’s customers. The statistician generates the following probability distribution of withdrawals for a specific day. Number of Probability Withdrawals 0 0.53 1 0.26 2 0.16 3 0.04 4 0.01 A. B. C. D. E. F. G. Define what the population is. The population is all customers at the CSULA Federal Credit Union. The characteristic we are concerned with is the customers’ withdrawals on a specific day. Define what the population mean is for the problem. The population mean is the average number of withdrawals on a particular for the population. Calculate the expected number of ATM withdrawals made on the specific day. The expected number of ATM withdrawals: μ=.74 What is the median number of withdrawals made that day? Zero. Calculate the variance and standard deviation in the number of withdrawals that day. The population variance is .8724. The standard deviation is .934. What is P(X>1)? .21 What is P(X≤2)? .95 2. A new math book costs $140 and a used one costs $80. A new chemistry book costs $180, a good used one costs $75, and a worn one costs $40. A student wants to buy the cheapest math book and chemistry book available in the bookstore. The probability of getting a used math book is .4, of getting a worn chemistry book is .3, and of getting a good used chemistry book is .2. Let X denote the cost of the two books the student purchases. Assume that the purchases are independent of one another. Construct the probability distribution of X. X P(X) 120 0.12 155 0.08 180 0.18 215 0.12 260 0.20 320 0.30 3. Suppose you agree to a bet involving a single toss of a fair coin. If the coin winds up heads, you win $200; if it is tails, you lose $100. Define X as the outcome of the bet for you. Construct the probability distribution of X. What is the expected value of X? What is the probability you will lose money? Event X P(X) T -100 0.50 H +200 0.50 What is the expected value of X? E(X)=$50. What is the probability you will lose money? 0.50 Now suppose the bet involves two coin tosses. The previously stated outcomes apply for each toss (win $200 if heads, lose $100 if tails). Define X as the dollar value of the intersection of events for the coin tosses. Construct the probability distribution of X. Event TT TH HT HH X -200 +100 +100 +400 P(X) .25 .25 .25 .25 What is the expected value of X? E(X)=$100. What is the probability you will lose money? 0.25 4. Farming is a very risky business because of the possibility that bad weather might cause financial ruin. Farmers usually insure their crops each year against possible losses resulting from bad weather. Determine the annual premium for an insurance policy to cover the farmer's $200,000 wheat crop. Insurance representatives believe there is a 3% probability that the crop will be totally destroyed by adverse weather, and a 5% probability of a $100,000 loss due to weather. Let X represent the expected loss to the farmer. X 0 $100,000 $200,000 P(X) 0.92 0.05 0.03 The expected value of X is $11,000. This equals the expected cost to the insurer, in which case the insurance premium will be at least $11,000. 5. Suppose you have been offered one share of stock from your boss as a Christmas bonus. She offers you a choice of Wal Mart or Sears stock. You know that you are going to hold the stock for one year. Below are the probability distributions of the two stocks’ prices a year from today. Wal Mart Stock $40 $50 $100 A. B. C. Probability Sears Probability Stock 0.25 .50 0.25 $45 $50 $120 0.10 0.80 .10 Fill in the above table. What is the expected price for the two stocks? The expected value of the Wal Mart stock is $60 after a year. The expected value of the Sears stock is $57. What is the variance and standard deviation for the two stocks' prices? Wal Mart Sears Stock Stock variance 550 450.25 standard 23.45 21.22 deviation D. Why should variance/standard deviation be considered in determining which stock to acquire? The variance and standard deviation are simple measures of the risk of holding a financial asset.
