file - BioMed Central
advertisement
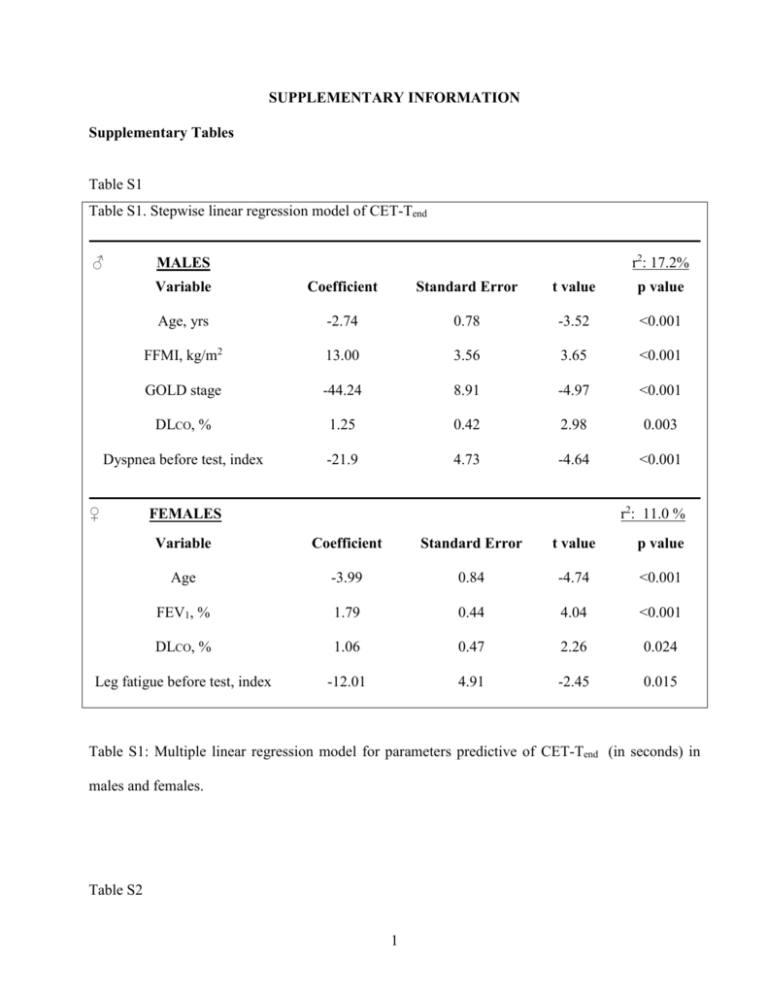
SUPPLEMENTARY INFORMATION Supplementary Tables Table S1 Table S1. Stepwise linear regression model of CET-Tend ♂ r2: 17.2% MALES Variable Coefficient Standard Error t value p value Age, yrs -2.74 0.78 -3.52 <0.001 FFMI, kg/m2 13.00 3.56 3.65 <0.001 GOLD stage -44.24 8.91 -4.97 <0.001 DLCO, % 1.25 0.42 2.98 0.003 Dyspnea before test, index -21.9 4.73 -4.64 <0.001 ♀ r2: 11.0 % FEMALES Variable Coefficient Standard Error t value p value Age -3.99 0.84 -4.74 <0.001 FEV1, % 1.79 0.44 4.04 <0.001 DLCO, % 1.06 0.47 2.26 0.024 Leg fatigue before test, index -12.01 4.91 -2.45 0.015 Table S1: Multiple linear regression model for parameters predictive of CET-Tend (in seconds) in males and females. Table S2 1 Table S2. Stepwise linear regression model of Six minute walking distance in meters ♂ r2: 32.5% MALES Variable Coefficient Standard Error t value p value Age, yrs -3.79 0.41 -9.22 <0.001 BMI, kg/m2 -3.46 0.81 -4.27 <0.001 FEV1, % 1.72 0.42 4.11 <0.001 FEV1/FVC, % -1.25 0.55 -2.26 0.024 GOLD stage -16.39 7.36 -2.23 0.026 DLCO, % 1.26 0.22 5.77 <0.001 Leg fatigue before test, index -19.28 2.32 -8.31 <0.001 ♀ r2: 35.9% FEMALES Variable Coefficient Standard Error t value p value Age -4.06 0.39 -10.43 <0.001 BMI, kg/m2 -4.92 0.69 -7.19 <0.001 FEV1, % 0.69 0.30 2.28 0.023 GOLD stage -16.04 6.61 -2.43 0.016 DLCO, % 1.01 0.22 4.50 <0.001 Leg fatigue before test, index -12.61 2.27 -5.55 <0.001 Table S2: Multiple linear regression model for parameters predictive of 6MWD (in meters) in males and females. Table S3 2 Table S3. Evidences of maximum CPET in 51 patients with CET ≥20min HRmax ≥80% predicted VEmax ≥85% MVV Dyspnea and/or leg fatigue ≥7 ↓ ↓ ↓ N= 31 (61%) patients N= 18 (35%) patients N= 43 (84%) patients Of rest patients: N= 20 (39%) Of rest patients: N= 33 (65%) Of rest patients: N= 8 (16%) ● 1 (2%) had only VEmax ● 5 (10%) had only HRmax ● 1 (2%) had only VEmax ≥85% MVV ≥80%pred. ≥85% MVV ● 12 (23%) had only dyspnea ● 13 (26%) had only dyspnea ● 5 (10%) had only HRmax and/or leg fatigue ≥7 by BORG and/or leg fatigue ≥7 by BORG ≥80%pred. ● 7 (14%) had both VEmax ● 15 (29%) had both HRmax ● 2 (4%) had both VEmax ≥85% 85% MVV & dyspnea and/or ≥80%pred. & dyspnea and/or leg MVV & HRmax ≥80%predicted leg fatigue by BORG scale fatigue by BORG scale Table S3: Percentages of patients who reached a high threshold value in heart rate (HRmax) and/or ventilation (VEmax) and/or Borg scores (Dyspnea/Leg Fatigue) as evidence of an achieved maximum effort during the maximum cardiopulmonary exercise test (CPET) in cycle ergometer. 3

