May 5th Problem Set
advertisement
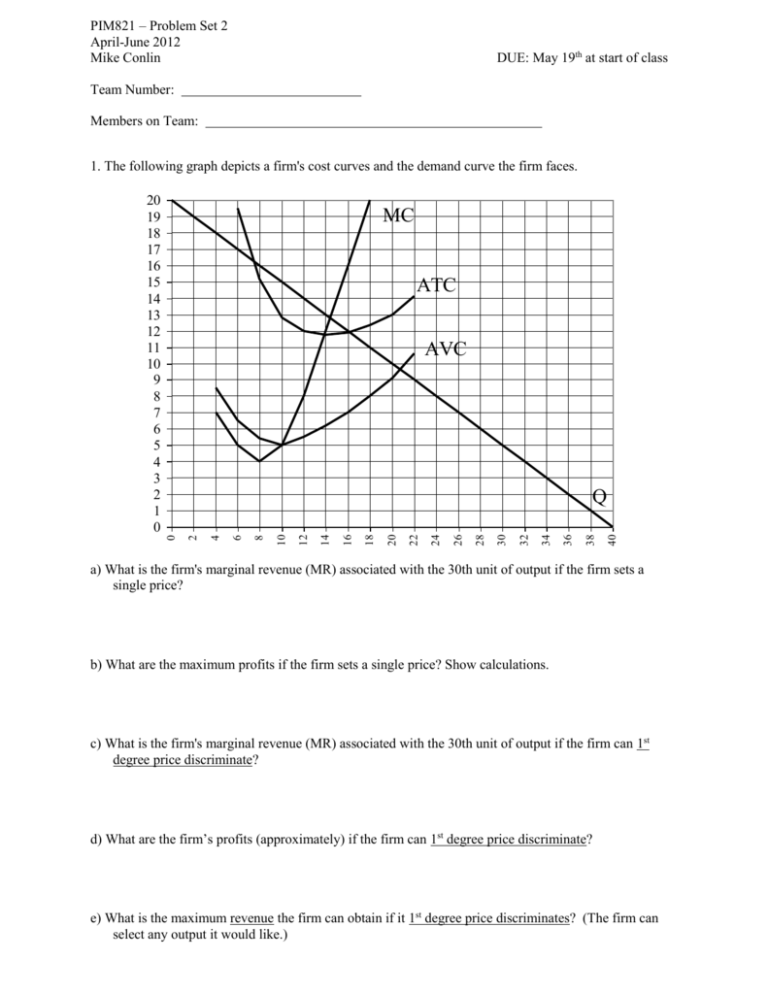
PIM821 – Problem Set 2 April-June 2012 Mike Conlin DUE: May 19th at start of class Team Number: Members on Team: 1. The following graph depicts a firm's cost curves and the demand curve the firm faces. 20 19 18 17 16 15 14 13 12 11 10 9 8 7 6 5 4 3 2 1 0 MC ATC AVC 40 38 36 34 32 30 28 26 24 22 20 18 16 14 12 10 8 6 4 2 0 Q a) What is the firm's marginal revenue (MR) associated with the 30th unit of output if the firm sets a single price? b) What are the maximum profits if the firm sets a single price? Show calculations. c) What is the firm's marginal revenue (MR) associated with the 30th unit of output if the firm can 1st degree price discriminate? d) What are the firm’s profits (approximately) if the firm can 1st degree price discriminate? e) What is the maximum revenue the firm can obtain if it 1st degree price discriminates? (The firm can select any output it would like.) 2. The demand curve for students who have applied for early admissions to John Hopkins University this year is given on the graph to the left. The demand curve for students who have applied to John Hopkins University this year, but not for early admissions, is given on the graph to the right. (Assume these are all the students who have the qualifications to be accepted into the program and that these qualifications are the same.) EARLY ADMISSIONS NO EARLY ADMISSIONS 40000 38000 36000 34000 32000 30000 28000 26000 24000 22000 20000 18000 16000 14000 12000 10000 8000 6000 4000 2000 0 20000 18000 16000 14000 De Dne 12000 10000 8000 6000 4000 360 300 240 180 120 60 0 0 200 160 120 80 40 0 2000 Suppose tuition at John Hopkins University is set at $25,000 and the marginal cost is constant at $4,000. (Marginal cost is just the increase in total cost associated with increasing the number of students by one.) If John Hopkins is to maximize profits, how much financial aid (i.e., scholarships) should be offered to students who apply for early admissions and how much to students who do not apply for early admissions? Explain. Assume that John Hopkins must provide the same financial aid to all those who apply early and the same financial aid to all those who do not apply early. However, John Hopkins can provide different amounts of financial aid to those who apply early and those who do not apply early. 3. The graphs below represent the demands for the Love Boat cruise from senior citizens and non-senior citizens. Non-Senior Citizens 500 500 450 450 400 400 350 350 300 300 250 250 200 200 150 DS 150 100 50 50 0 0 0 20 40 60 80 100 120 140 160 180 200 220 240 100 DNS 0 20 40 60 80 100 120 140 160 180 200 220 240 Senior Citizens Let the Love Boat’s total capacity be 200 passengers. Suppose total fixed costs (TFC) are $50,000 and marginal cost (at quantities less than and equal to capacity) is constant at $100. (The marginal cost is extremely high when quantity is more than capacity.) What are the Love Boat’s maximum profits if they are able to third degree price discriminate (i.e., charge senior citizens a different price than non-senior citizens)? SHOW CALCULATIONS. 4. Suppose the demand for local telephone service in East Lansing is from two types of individuals. There are 200 type A individuals and 100 type B individuals. Each type’s individual demand curve is depicted on the graphs below (where q is the number of local phone calls per month). The telephone company cannot distinguish between type A and type B individuals. The marginal cost of a local phone call is constant at $0.10 and the telephone company’s monthly fixed costs are $1000. Suppose the telephone company charges $0.40 per call and a monthly fixed fee that maximizes their profits. Type A Type B 1.2 1.1 1 0.9 0.8 0.7 0.6 0.5 0.4 0.3 0.2 0.1 0 0.2 0 0 1 2 3 4 5 6 7 8 12 0.4 10 0.6 DB 8 DA 6 1 0.8 4 1.2 2 1.4 0 1.6 What are the telephone company’s profits from this 2-part pricing scheme? SHOW CALCULATIONS. 5. The first graph on the next page depicts a monopolist’s cost curves and the market demand curve the monopolist faces. The market demand curve is based on demand from 4 Type A individuals and 3 Type B individuals. The demand curve for each Type A individual is depicted on the next page, along with the demand curve for each Type B individual. Suppose the monopolist decides on a twopart pricing scheme where the monopolist charges a fixed fee (often called membership or entry fee) and variable fee (often called a per unit fee). Assume the monopolist charges a variable fee of $10 per unit. a) If the monopolist cannot distinguish between type A and type B individuals, what fixed fee will the monopolist select to maximize profits? SHOW ALL CALCULATIONS. b) Now suppose that the monopolist can hire Mike Conlin who can distinguish a Type A individual from a Type B individual. Therefore, if the monopolist hires Mike Conlin, the monopolist can offer Type A individuals a different pricing scheme than Type B individuals. What is the maximum amount the monopolist is willing to pay Mike Conlin? SHOW CALCULATIONS. 30 29 28 27 26 25 24 23 22 21 20 19 18 17 16 15 14 13 12 11 10 9 8 7 6 5 4 3 2 1 0 D MC ATC TYPE A 30 27.5 27.5 25 25 22.5 22.5 20 20 17.5 17.5 15 15 12.5 12.5 10 10 7.5 7.5 DA 30 28 26 6 5 4 3 2 1 0 6 5 4 0 3 0 2 2.5 1 DB 5 2.5 0 24 TYPE B 30 5 22 20 18 16 14 12 10 8 6 4 2 0 AVC 6. You own an Italian restaurant that serves only a fettuccine alfredo meal. The graph below depicts the demand for your fettuccine alfredo meal during dinner (DD) and during lunch (DL). Suppose your marginal cost for each meal is $9 during dinner and $4 during lunch. (The difference in the marginal cost is because you serve larger portions at dinner and labor is more expensive during dinner time.) Also assume that you have a capacity of 150 seats in your restaurant and your fixed costs per day are $750. 20 19 18 17 16 15 14 13 12 11 10 9 8 7 6 5 4 3 2 1 0 DD What are your daily profits? Show Calculations. 1000 900 800 700 600 500 400 300 200 100 0 DL 7. Sorry I could not make this question applicable to MSU. If only the football and basketball teams played in the same arena. At Syracuse University, both teams played in the Carrier Dome. The good news is that MSU is better than SU in both football and basketball – although basketball is close. Suppose the graph below depicts the demand curves for each Syracuse University football game in the Carrier Dome, Df , and for each Syracuse University basketball game in the Carrier Dome, Db . Assume the football team plays 5 games each year in the Carrier Dome and the basketball team plays 10 games each year in the Carrier Dome. Also assume that the Carrier Dome seats 20,000 more people for a football game than for a basketball game because for basketball games SU blocks off several sections of seats. (For example, if the Carrier Dome has 60,000 seats, then the number of people that can watch a football game is 60,000 and the number that can watch a basketball game is 40,000.) Let the marginal cost of a person attending an SU football or basketball game be constant at $20. In addition, suppose the Carrier Dome has 50,000 seats and the annual fixed costs are $10 million. 100000 q b , qf 90000 70000 60000 50000 40000 30000 20000 10000 80000 Df Db 0 100 90 80 70 60 50 40 30 20 10 0 What are Syracuse University’s annual total profits from football and basketball games? Show your calculations. 8. (This question is based on an experience my mom and sister had when planning a trip to Hawaii.) Suppose you operate a 400 room resort in Hawaii which offers rooms and dinners for vacationers. You must decide how to price a room and a dinner. Your clientele consists of two types of customers. Type I customers value the room at $300 and the dinner at $50. Type II customers value the room at $250 and the dinner at $75. There are 100 Type I customers and 200 Type II customers. Your costs are $50 for every person you provide a room and $25 for every person you provide a dinner. a) What are your maximum profits if you decide to set one price for the room (pR) and a separate price for the dinner (pD)? b) What are your maximum profits if you decide to bundle the room and dinner by setting one price for the room and dinner (pRD)? c) What are your maximum profits if you decide to use a mixed bundling pricing strategy? 9. This question is based on my experience buying stuff for my kids. Graco is a manufacturer of car seats for infants. Graco is deciding whether to offer a rebate on its Snugrite car seat and, if a rebate is offered, Graco must decide how long to make the rebate form (i.e., number of pages). Graco has two types of customers: Type A’s and Type B’s. Assume that Graco cannot distinguish between the types. Type A’s are willing to pay a maximum of $180 for a Snugrite car seat and Type B’s are willing to pay a maximum of $160 for a Snugrite car seat (assuming they do not have to fill out the rebate form). There are 30 Type A’s and 20 Type B’s. Suppose the opportunity cost per page associated with filling out the rebate is $10 for Type A’s and $5 for Type B’s. Assume that Graco’s marginal cost of a Snugrite car seat is constant at $40 and Graco’s fixed costs are $1,000. What price should Graco charge for the Snugrite car seat, what should be the amount of the rebate and how many pages should Graco make the rebate form? SHOW CALCULATIONS.


