hcl - WordPress.com
advertisement
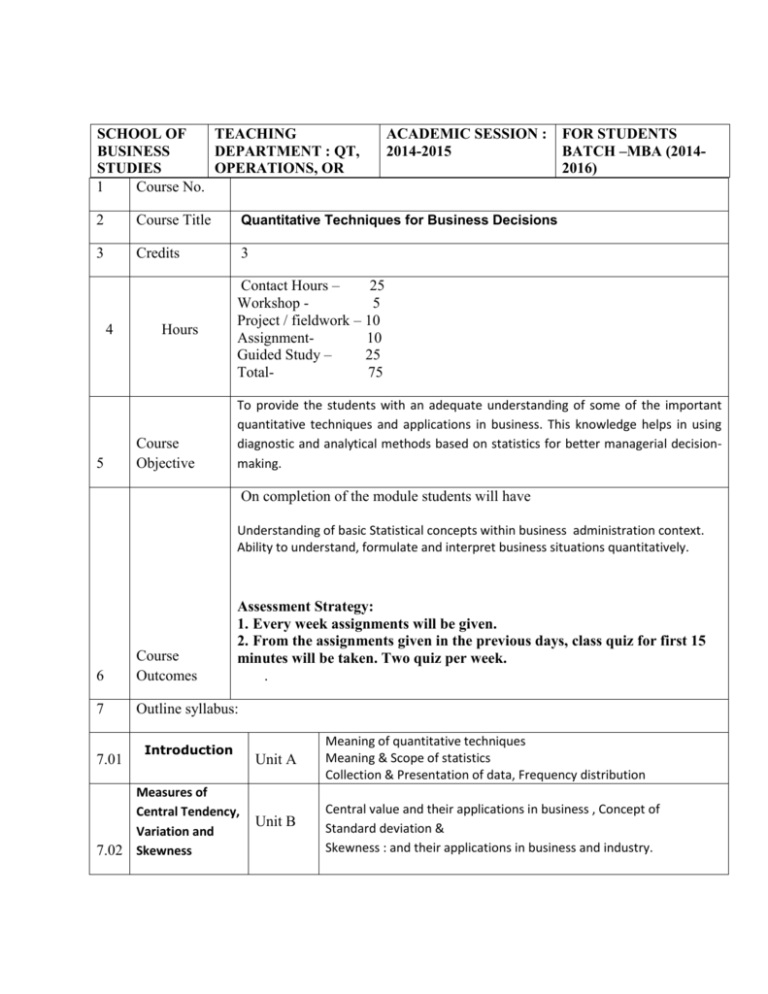
SCHOOL OF TEACHING BUSINESS DEPARTMENT : QT, STUDIES OPERATIONS, OR 1 Course No. ACADEMIC SESSION : 2014-2015 2 Course Title Quantitative Techniques for Business Decisions 3 Credits 3 4 5 Hours Course Objective FOR STUDENTS BATCH –MBA (20142016) Contact Hours – 25 Workshop 5 Project / fieldwork – 10 Assignment10 Guided Study – 25 Total75 To provide the students with an adequate understanding of some of the important quantitative techniques and applications in business. This knowledge helps in using diagnostic and analytical methods based on statistics for better managerial decisionmaking. On completion of the module students will have Understanding of basic Statistical concepts within business administration context. Ability to understand, formulate and interpret business situations quantitatively. Assessment Strategy: 1. Every week assignments will be given. 2. From the assignments given in the previous days, class quiz for first 15 minutes will be taken. Two quiz per week. . 6 Course Outcomes 7 Outline syllabus: 7.01 Introduction Measures of Central Tendency, Variation and 7.02 Skewness Unit A Meaning of quantitative techniques Meaning & Scope of statistics Collection & Presentation of data, Frequency distribution Unit B Central value and their applications in business , Concept of Standard deviation & Skewness : and their applications in business and industry. 7.03 Probability and Unit C Probability Distributions 7.04 Correlation &Regression Unit D Tests of 7.05 Hypothesis Unit E 8 Course Evaluation 8.1 Course work: Meaning and relevance to managerial decision-making Basic rules of Probability Baye’s Theorem & its applications, Concept of Probability distribution, Binomial Distribution, Poisson Distribution and Normal Distribution and its applications. Linear Correlation Scatter Diagram Coefficient of correlation Linear Regression. Meaning & purpose of tests of hypothesis Various steps involved in testing of hypothesis Two-tailed and one-tailed tests Z-test t-test and Chi-square test 8.11 Attendance 8.12 Homework (3) 15% 8.13 Quizzes (6) 15% 8.14 Projects 8.15 Presentations 8.16 Any other (give details and weight) 8.2 MTE (one) 20% 8.3 End-term examination: weight 9 References 50% Business Statistics by M.P. Gupta and S.P. Gupta, 2014 Edition, Sultan Chand & Sons, New Delhi. 9.1 Text book Mapping of Outcomes vs. Topics Outcome no. → Syllabus topic↓ XXXNNN.A XXXNNN.A1 XXXNNN.A2 XXXNNN.A3 XXXNNN.B XXXNNN.B1 XXXNNN.B2 XXXNNN.B3 XXXNNN.C XXXNNN.C1 XXXNNN.C2 XXXNNN.C3 XXXNNN.D XXXNNN.D1 XXXNNN.D2 XXXNNN.D3 XXXNNN.E XXXNNN.E1 XXXNNN.E2 XXXNNN.E3 1 2 3 4 5 6 7 8
