ExponentialFolds
advertisement
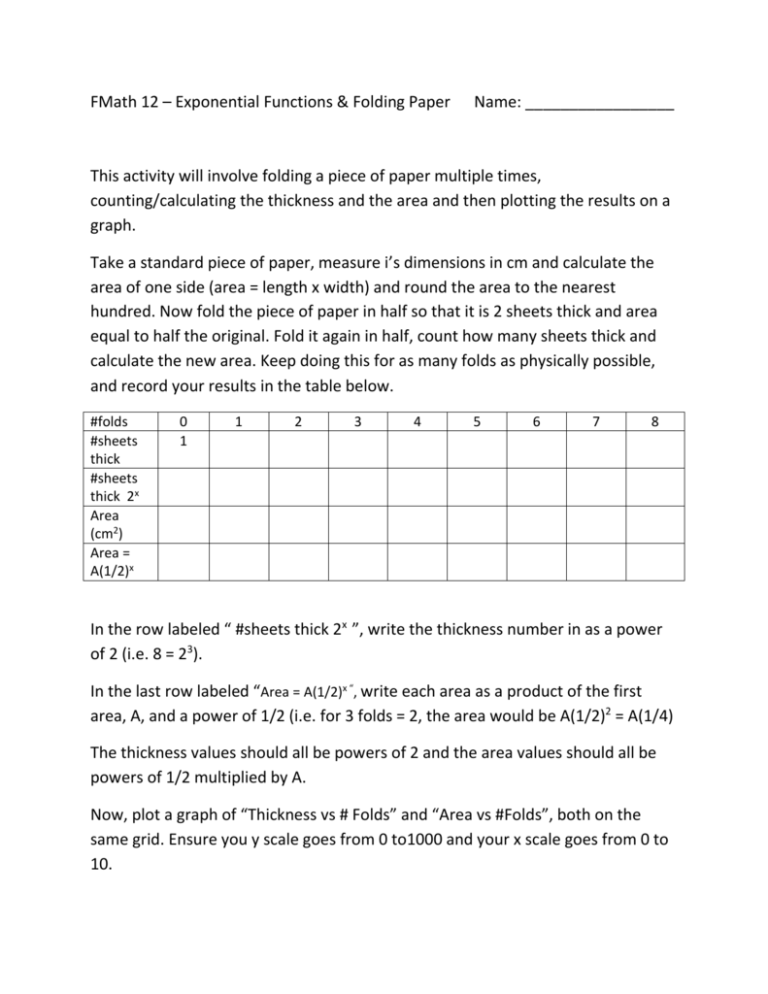
FMath 12 – Exponential Functions & Folding Paper Name: _________________ This activity will involve folding a piece of paper multiple times, counting/calculating the thickness and the area and then plotting the results on a graph. Take a standard piece of paper, measure i’s dimensions in cm and calculate the area of one side (area = length x width) and round the area to the nearest hundred. Now fold the piece of paper in half so that it is 2 sheets thick and area equal to half the original. Fold it again in half, count how many sheets thick and calculate the new area. Keep doing this for as many folds as physically possible, and record your results in the table below. #folds #sheets thick #sheets thick 2x Area (cm2) Area = A(1/2)x 0 1 1 2 3 4 5 6 7 8 In the row labeled “ #sheets thick 2x ”, write the thickness number in as a power of 2 (i.e. 8 = 23). In the last row labeled “Area = A(1/2)x “, write each area as a product of the first area, A, and a power of 1/2 (i.e. for 3 folds = 2, the area would be A(1/2)2 = A(1/4) The thickness values should all be powers of 2 and the area values should all be powers of 1/2 multiplied by A. Now, plot a graph of “Thickness vs # Folds” and “Area vs #Folds”, both on the same grid. Ensure you y scale goes from 0 to1000 and your x scale goes from 0 to 10. Answer the following questions: 1. As the #Folds increases, explain how the thickness changes and the area changes. What are the patterns? 2. As the #Folds increases, explain how the slope of each curve changes. 3. If one could fold a sheet of paper many more times, how many sheets thick would the thickness be after 20 folds? (Hint: 500 sheets has a thickness of of 4 cm) Show you calculations. 4. How many times would the sheet need to be folded for the thickness to become 1 metre? Show your calculations. 5. Describe the characteristics of each graph (# of x-intercepts, # of yintercepts, domain, range, turning points, end behaviour). 6. The general form of an exponential functions is y = a(b)x. a and b are called parameters. Using this form, write the equations for your two graphs with the correct parameter values. 7. A similar relationship involves the famous problem of the exponential salary. Assume on the first day of the month, you receive a nickel for your day’s work. On the second day, you received double. Each day after, your salary doubles again and again. What would be your salary on the 30th day? Attach your graphs to this paper and hand in by the end of class, even if it is not complete.
