AP Statistics Hypothesis Testing: Mixed Practice For each problem
advertisement
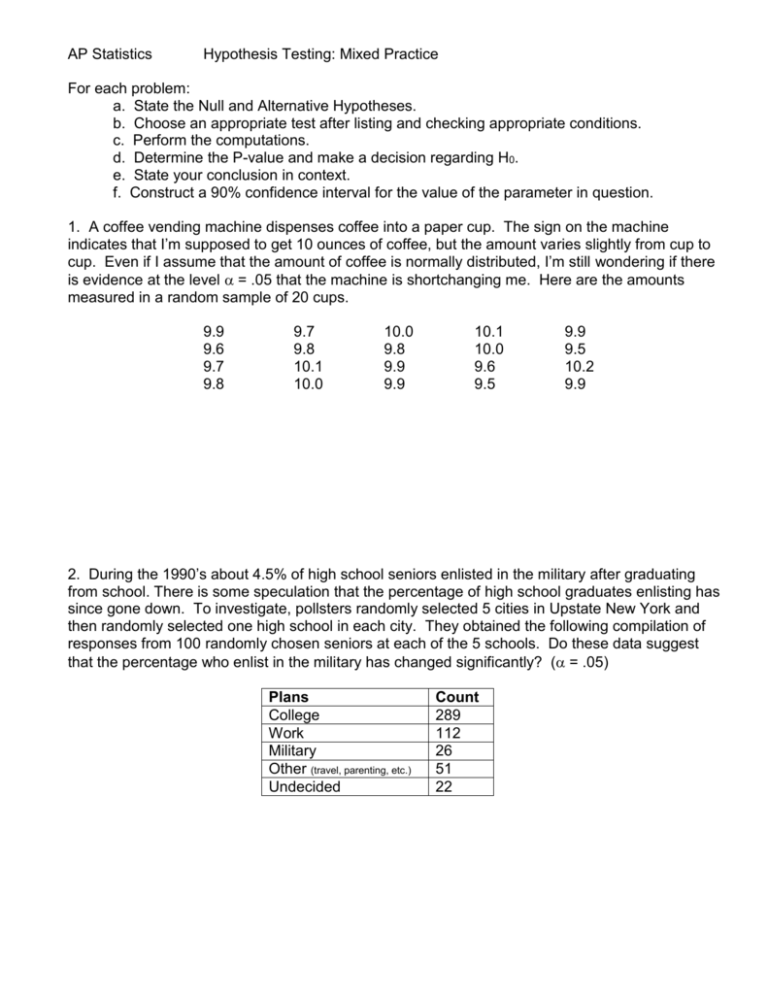
AP Statistics Hypothesis Testing: Mixed Practice For each problem: a. State the Null and Alternative Hypotheses. b. Choose an appropriate test after listing and checking appropriate conditions. c. Perform the computations. d. Determine the P-value and make a decision regarding H0. e. State your conclusion in context. f. Construct a 90% confidence interval for the value of the parameter in question. 1. A coffee vending machine dispenses coffee into a paper cup. The sign on the machine indicates that I’m supposed to get 10 ounces of coffee, but the amount varies slightly from cup to cup. Even if I assume that the amount of coffee is normally distributed, I’m still wondering if there is evidence at the level = .05 that the machine is shortchanging me. Here are the amounts measured in a random sample of 20 cups. 9.9 9.6 9.7 9.8 9.7 9.8 10.1 10.0 10.0 9.8 9.9 9.9 10.1 10.0 9.6 9.5 9.9 9.5 10.2 9.9 2. During the 1990’s about 4.5% of high school seniors enlisted in the military after graduating from school. There is some speculation that the percentage of high school graduates enlisting has since gone down. To investigate, pollsters randomly selected 5 cities in Upstate New York and then randomly selected one high school in each city. They obtained the following compilation of responses from 100 randomly chosen seniors at each of the 5 schools. Do these data suggest that the percentage who enlist in the military has changed significantly? ( = .05) Plans College Work Military Other (travel, parenting, etc.) Undecided Count 289 112 26 51 22 3. An admissions officer at a small liberal arts college suspects that male applicants to its honors engineering program outscore female applicants on a specially designed placement test. A random sample of applicants for admissions in 2011 resulted in the following data: Gender Male Female Sample size 32 36 Mean Score 75.5 71.2 Standard Deviation 10.3 11.4 Do these data indicate there is a significant difference ( = .05) among these two groups of applicants? 4. A bio-engineering firm claims that no more than 5% of its artificial joints will fail within 4 years of implantation. A simple random sample of 192 recipients found that 17 had artificial joints that had failed within 4 years. Test at the level = .01 whether or not these sample data suggest that the company’s claim is too low. 5. A recent article in a local magazine stated that high school seniors contributed an average of 87.5 hours of community service. In a random sample of 52 seniors, the mean number of community service hours worked was 90 with a standard deviation of 12.5 hours. Test whether or not these data cast doubt on the magazine’s claim at the level = .05. Mixed Hypothesis Test Answers 1. Coffee Machine. I think the machine is dispensing less than the advertized 10 ounces of coffee. H0: = 10 HA: < 10 Random? stated Normal? assumed Independent? Presumably, the machine dispenses more than 200 cups of coffee. x 9.845 10 3.49 Use a one-sample t-test. t s x .1986 n 20 P-value: P t 3.49 =.0012 < .05 so we reject H0. There is statistically strong evidence that the coffee machine is dispensing less than 10 ounces of coffee. Based on my sample evidence, I am 90% confident that the average cup of coffee from the machine contains between 9.77 and 9.92 ounces. Notice: Even the high end of the confidence interval was lower than the advertized figure of 10 ounces. It’s no surprise, then that we rejected the null hypothesis. 2. Military Enlistment We wonder if the proportion of seniors enlisting has gone down from the advertized 4.5% figure. H0: = .045 HA: < .045 Random? stated Normal? np > 10, n(1 – p) > 10? Yes, 26 > 10 and 474 > 10 Independent? Yes, there are more than 5000 seniors in Upstate New York schools. p̂ .052 .045 .755 Use a one-sample z-test. z (1 ) (.045)(.955) n 500 P-value: P z .755 =.774 > .05 so we cannot reject H0. The evidence does not indicate that the percentage of seniors enlisting in the military has gone down. On the contrary, the data suggest the exact opposite, that the percentage may have gone up slightly, (since .052 > .045), although, there too, the amount is not statistically significant. Based on this recent tally, we can be 90% confident that the actual percentage of seniors who will enlist in the military is between 3.6% and 6.8%, so it may not have changed from the previous mark. 3. Engineering Placement Test We wonder if the mean score for male applicants is higher than the mean score for female applicants. H0: Male – Female = 0 HA: Male – Female > 0 Random? stated Normal? n1 = 32 > 30, n2 = 36 > 30 so the distribution will be roughly normal. Independent? Applicants’ scores are presumably independent. ( x1 x2 ) (1 2 ) (75.5 71.2) (0) 1.634 Use a two-sample t-test. t 2 2 2 2 s1 s2 (10.3) (11.4) 32 36 n1 n2 P-value: P t 1.634 =.0535 > .05 so we cannot reject H0. (close, but not quite.) Although the males in the sample had a higher mean score than the females, the evidence is not strong enough to assert that men, in general, score higher on the test than women do. Based on our evidence, we 90% confident that the actual difference in the average scores of the two groups is between = -.09 and 8.69. 4. Artificial Joints We wonder if the proportion of artificial joints that fail is more than the advertized figure of 5%. H0: = .05 HA: > .05 Random? stated Normal? np > 10, n(1 – p) > 10? Yes, 17 > 10 and 165 > 10 Independent? Yes, we presume there were a large number of joint replacements. p̂ .0885 .05 2.448 Use a one-sample z-test. z (1 ) (.05)(.95) n 192 P-value: P z 2.448 =.007 < .05 so we reject H0. We have strong evidence that the percentage of artificial joints that fail within the first 4 years is higher than the company’s advertized figure of 5%. Based on our evidence, we are 90% confident that the actual percentage of artificial joints that fail within the first 4 years is between 5.48% and 12.23%. Notice: The lower end of the confidence interval was higher than the advertized figure. It should come as no surprise, then, that we rejected the null hypothesis. 5. Community Service We wonder if the number of hours high school seniors devote to community service is higher than 87.5, the figure published by the local magazine. H0: = 87.5 HA: > 87.5 Random? stated Normal? n > 30? Yes, our sample had 52 Independent? Yes, 52 is presumably a small fraction of the total number of seniors attending local high schools.. Use a one-sample t-test. t x sx n 90 87.5 12.5 52 1.442 P-value: P t 1.442 =.078 > .05 so we cannot reject H0. Although the mean of 90 hours community service posted by our sample was higher than the advertized 87.5 hours, it was not strong enough evidence to refute the magazine’s claim. Based on our evidence, we are 90% confident that the mean number of hours local high school seniors devote to community service is between 87.1 and 92.9. The calculator does a lot of this work for us, but to receive full credit on the AP, we need to write enough of to convince the examiners that we know what the calculator is doing. That includes showing the computations and stating the conclusion in context.
![저기요[jeo-gi-yo] - WordPress.com](http://s2.studylib.net/store/data/005572742_1-676dcc06fe6d6aaa8f3ba5da35df9fe7-300x300.png)
