ans-SSEx3-fall
advertisement
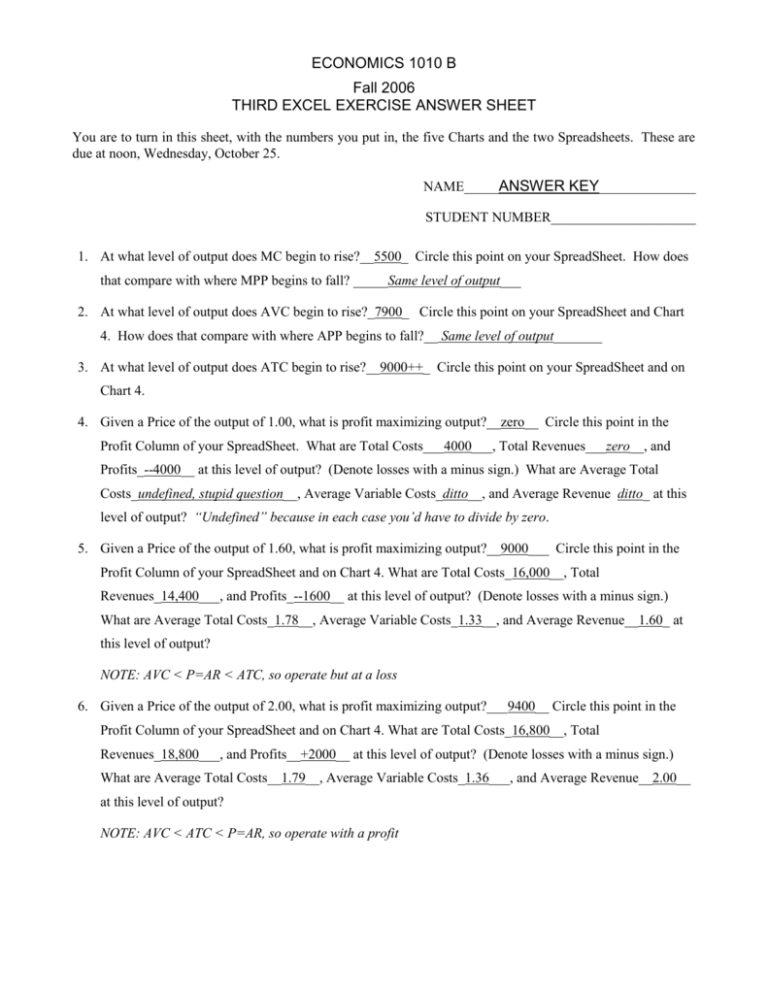
ECONOMICS 1010 B Fall 2006 THIRD EXCEL EXERCISE ANSWER SHEET You are to turn in this sheet, with the numbers you put in, the five Charts and the two Spreadsheets. These are due at noon, Wednesday, October 25. NAME_____ANSWER KEY______________ STUDENT NUMBER_____________________ 1. At what level of output does MC begin to rise?__5500_ Circle this point on your SpreadSheet. How does that compare with where MPP begins to fall? _____Same level of output___ 2. At what level of output does AVC begin to rise?_7900_ Circle this point on your SpreadSheet and Chart 4. How does that compare with where APP begins to fall?__ Same level of output_______ 3. At what level of output does ATC begin to rise?__9000++_ Circle this point on your SpreadSheet and on Chart 4. 4. Given a Price of the output of 1.00, what is profit maximizing output?__zero__ Circle this point in the Profit Column of your SpreadSheet. What are Total Costs___4000___, Total Revenues___zero__, and Profits_--4000__ at this level of output? (Denote losses with a minus sign.) What are Average Total Costs_undefined, stupid question__, Average Variable Costs_ditto__, and Average Revenue ditto_ at this level of output? “Undefined” because in each case you’d have to divide by zero. 5. Given a Price of the output of 1.60, what is profit maximizing output?__9000___ Circle this point in the Profit Column of your SpreadSheet and on Chart 4. What are Total Costs_16,000__, Total Revenues_14,400___, and Profits_--1600__ at this level of output? (Denote losses with a minus sign.) What are Average Total Costs_1.78__, Average Variable Costs_1.33__, and Average Revenue__1.60_ at this level of output? NOTE: AVC < P=AR < ATC, so operate but at a loss 6. Given a Price of the output of 2.00, what is profit maximizing output?___9400__ Circle this point in the Profit Column of your SpreadSheet and on Chart 4. What are Total Costs_16,800__, Total Revenues_18,800___, and Profits__+2000__ at this level of output? (Denote losses with a minus sign.) What are Average Total Costs__1.79__, Average Variable Costs_1.36___, and Average Revenue__2.00__ at this level of output? NOTE: AVC < ATC < P=AR, so operate with a profit 7. Fill in the table below to get the individual farm’s supply curve and the industry supply curve. The corn industry is 1000 identical corn farms. Price of corn $/bushel 0.90 Single farm Quantity Supplied zero Corn Industry Quantity Supplied zero 1.00 zero zero 1.14 zero zero 1.33 8500 8,500.000 1.60 9000 9,000,000 2.00 9400 9,400,000 2.67 9700 9,700,000 4.00 9900 9,900,000 8.00 10,000 10,000,000
