AP Statistics – Probability Review
advertisement

AP Statistics – Probability Review Solutions
1. A randomly selected student is asked to respond to the question, “Do you watch TV
when you eat dinner?” The sample space is {always, often, seldom, never}. Which of the
following represents a legitimate assignment of probabilities for this sample space?
a) .25, .25, .25, .25
b) .4, .3, .1, .2
c) .5, .4, 0, .1
d) 0, 0, 0, 1
e) all of these
2. If you choose a card at random from a well-shuffled deck of 52 cards, what is the
probability that the card chosen is a red card or an ace?
a) .5
b) .577
c) .558
d) .038
e) none of these
3. If P(A) = .38 and P(B) = .61 and A and B are independent, what is P(A or B)?
a) .2318
b) .99
c) .7582
d) .6162
e) not enough info
The next 3 problems deal with the following situation. Lexus automobiles come in the
following colors and are manufactured in these percentages.
White
.46
Black
.22
Red
.09
Silver
.11
Gold
.12
4. If I choose a car at random, the probability that I do not choose a white or black car is:
a) .68
b) .46
c) .20
d) .32
e) none of these
5. If I select 2 cars at random, what is the probability that the two cars are both white?
a) .92
b) .2116
c) .23
d) .7084
e) none of these
6. If I select 2 cars at random, what is the probability that the two cars are the same color?
a) .2116
b) .2946
c) .2
d) .04
e) none of these
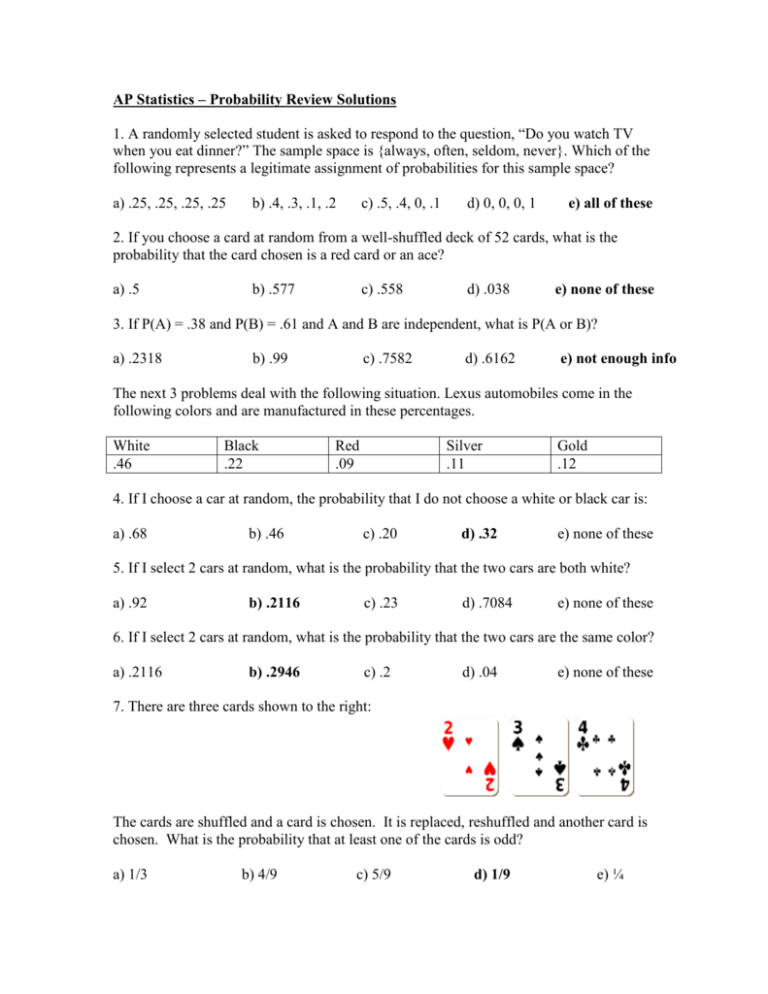
7. There are three cards shown to the right:
The cards are shuffled and a card is chosen. It is replaced, reshuffled and another card is
chosen. What is the probability that at least one of the cards is odd?
a) 1/3
b) 4/9
c) 5/9
d) 1/9
e) ¼
8. An experiment consists of choosing a card from a standard deck of cards and replacing
it. If I perform the experiment 1,000 times, about how many times would you expect to
choose an ace?
a) 13
b) 79 (77)
c) 99
d) 250
e) cannot be
determined
9. Let A be the event: Getting all A’s in your courses. Then Ac is:
a) Getting at least one B
b) Getting all F’s
d) Getting some A’s
c) Getting no A’s
e) At least one course in which you didn’t get an A
10. Two fair dice are rolled. Find the following probabilities.
a) the sum is 7
1/6
b) the sum is greater than 9 or less than 5 1/3
c) the sum is a perfect square
7/36
d) the sum is even or divisible by 5 11/18
e) if the sum is even, it is also divisible by 5 f) if the sum is divisible by 5, it is also even
1/6
3/7
11. A fair coin is tossed six times. Find the probability.
a) getting all heads
1/64
b) all the tosses are the same 1/32
12. Suppose you are given a standard six-sided die that is loaded. It is fixed in such a way that the
sample space occurs with the following probabilities:
Outcome
1
Probability .25
2
.25
3
.2
4
.1
5
.1
6
.1
a) Let A be the event: the number rolled is divisible by 2. List the outcomes in A and then
find P(A).
A = {2, 4, 6} P(A) = .45
b) Let B be the event: the number rolled is divisible by 3. List the outcomes in B and then
find P(B).
B = {3, 6} P(B) = .3
c) Find P(A|B) 1/3
d) Find P(B|A)
2/9
e) Are A and B mutually exclusive? Explain briefly. No, A and B happen
simultaneously if a 6 is rolled.
f) Are A and B independent? Explain or prove. No, A influences the probability of B and vice
versa. Or, mathematically…. (.45)(.3) ≠ .1
13. A survey was taken among a group of people. The probability that a person chosen
likes Italian food (event A) is 0.79, the probability that a person likes Chinese food (event
B) is .48, and the probability of that a person likes both foods is .31.
a) Draw a Venn diagram that shows the relation between the events A and B.
Use your Venn diagram to find the probability:
b) a person likes Italian but not Chinese .48
c) a person likes at least one of these foods .96
d) a person likes at most one of these foods .69
e) If a person likes Italian, he also likes Chinese .3924
f) If a person likes Chinese, he also likes Italian .6458
14. Ed is a student who has the usual student complaint: “Usually I do my homework and
the teacher never checks it and when I don’t do my homework, the teacher usually checks
it.” Here are the statistics:
The teacher checks homework 38% of the time. When she doesn’t check homework, Ed
has done his homework 84% of the time. When she does check homework, Ed has done it
52% of the time. Make a tree diagram that illustrates these statistics and find the
following probabilities:
a) if Ed does his homework, the teacher doesn’t check it .7249
b) if Ed doesn’t do his homework, the teacher does check it. .6477
c) Is Ed justified in his complaint based on what you just found? Why?


