Activity8-Binomial-Probab
advertisement
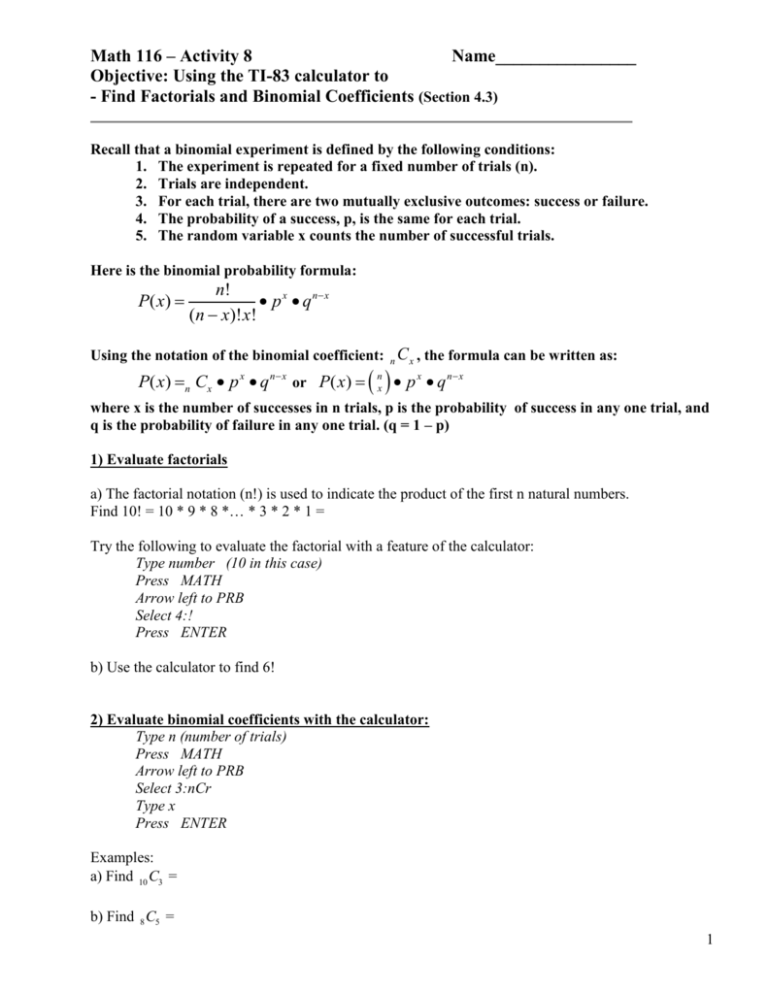
Math 116 – Activity 8 Name________________ Objective: Using the TI-83 calculator to - Find Factorials and Binomial Coefficients (Section 4.3) Recall that a binomial experiment is defined by the following conditions: 1. The experiment is repeated for a fixed number of trials (n). 2. Trials are independent. 3. For each trial, there are two mutually exclusive outcomes: success or failure. 4. The probability of a success, p, is the same for each trial. 5. The random variable x counts the number of successful trials. Here is the binomial probability formula: P( x) n! p x q n x (n x)! x! Using the notation of the binomial coefficient: n C x , the formula can be written as: P( x) n Cx p x q n x or P( x) nx p x q n x where x is the number of successes in n trials, p is the probability of success in any one trial, and q is the probability of failure in any one trial. (q = 1 – p) 1) Evaluate factorials a) The factorial notation (n!) is used to indicate the product of the first n natural numbers. Find 10! = 10 * 9 * 8 *… * 3 * 2 * 1 = Try the following to evaluate the factorial with a feature of the calculator: Type number (10 in this case) Press MATH Arrow left to PRB Select 4:! Press ENTER b) Use the calculator to find 6! 2) Evaluate binomial coefficients with the calculator: Type n (number of trials) Press MATH Arrow left to PRB Select 3:nCr Type x Press ENTER Examples: a) Find 10 C3 = b) Find 8 C5 = 1 Math 116 – Activity 8 – Part 3 Objective: - Find Binomial Probabilities with the formula and with the calculator (Section 4.3) Find binomial probabilities with the formula P( x) n! p x q n x (n x)! x! 3) A surgical technique is performed on seven patients. You are told there is a 70% chance of success. Find the probability that the surgery is successful for exactly five patients. . Find (single) binomial probabilities with the calculator The instructions in the home screen of the calculator should read binompdf(n,p,x) Where to find this: Binompdf(….. is in the 2nd VARS[DISTR] menu 4) Solve problem (3) with the calculator. 5) You are taking a multiple-choice quiz that consists of five questions. Each question has four possible answers, only one of which is correct. To complete the quiz, you randomly guess the answer to each question. Find the probability of guessing exactly three answers correctly. (a) Use the formula (b) Use a feature of the calculator 2 Math 116 – Activity 8 Objective: - Find Binomial Probabilities with the formula and with the calculator (Section 4.3) Find cumulative binomial probabilities with the calculator The instructions in the home screen of the calculator should read binomcdf(n,p,x) (this finds cumulative probabilities from 0 to x) Where to find this: Binomcdf(….. is in the 2nd VARS[DISTR] menu 6) Seventy percent of married couples paid for their honeymoon themselves. (Source: Bride’s Magazine) You randomly select 20 married couples and ask each if they paid for their honeymoon themselves. Find the probability that the number of couples who say they paid for their honeymoon themselves is (a) Less than seven. (b) At most seven. 7) About 28% of college students earn at least $400 per month. You select at random five college students and ask each if he or she earns at least $400 per month. What is the probability that (a) More than 3 earn at least $400 per month? (b) At least 3 earn at least $400 per month? 8) United Airlines flight 1832 from Chicago to Orlando is on time 80% of the time according to United Airlines. Suppose15 flights are randomly selected. Find the probability that (a) Between 8 and 12 flights, inclusive, are on time. (b) Strictly between 8 and 12 flights are on time. 3 Math 116 – Activity 8 Objective: Using the TI83 calculator to - Construct Binomial Probability Distributions (Section 4.3) Construct binomial probability distributions with the calculator To get a list of all the probabilities corresponding to x = 0, 1, 2, …., n: Use binompdf(n,p) and scroll to the right to read the probabilities The instructions in the home screen of the calculator should read binompdf(n,p) Where to find this: Binompdf(….. is in the 2nd VARS[DISTR] menu 9) Construct the probability distribution for the binomial experiment with n = 3 and p = 0.8. X P(X=x) 10) Construct the probability distribution for the binomial experiment of problem 5, where n = 5 and p = 1/4. (Five multiple choice questions with 4 possible answers one of which is correct) X P(X=x) 4 Math 116 – Activity 8 Objective: Using the TI83 calculator to - Construct Binomial Probability Histograms (Section 4.3) Constructing Probability Histograms for Binomial Experiments with the TI83/84 Calculator 11) Use the calculator to construct the probability distribution and histogram for the binomial experiment with n = 12 and p = .5 a) Store the possible values of the random variable, 0 – 12, into L1. Here is a fancy way of doing this: The instructions in the home screen of the calculator should read Seq(x,x,0,12,1) →L1 Where to find this: The Sequence feature is in the 2nd STAT[LIST] menu (arrow to OPS) The STOre key is in the first column of the calculator L1 is the 2nd function of the key for number 1 b) Calculate the probabilities for each value of the random variable and store them into L2. The instructions in the home screen of the calculator should read: Binompdf(n,p)→L2 Where to find this: Binompdf(…….. is in the 2nd VARS[DISTR] menu c) Explore the editor of the calculator to make sure you have the probability distribution in lists 1 and 2 of the calculator. How to do this: Press STAT, select 1:Edit d) Construct the probability histogram for the experiment. Use plot 1 to graph the data stored into L1 and L2. How to do this: Set up the histogram in the 2nd Y=[STAT PLOT] window Use the WINDOW [-3.5, 15.5, 1] for x and [-.3, .5, 1] for y Press GRAPH Press TRACE and scroll right to observe the probabilities (think on usual and unusual outcomes) e) Describe the shape of the distribution. 5 Math 116 – Activity 8 Objective: Using the TI83 calculator to - Construct Binomial Probability Histograms (Section 4.3) Constructing Probability Histograms for Binomial Experiments with the TI83/84 Calculator 12) Construct the probability distribution for the binomial experiment with n = 12 and p = .2 Store the random variable into L1 (already done) Store the probabilities into L3. (See previous page for instructions) Use Plot 2 to graph the data stored into L1 and L3. (Turn off plot 1) What is the shape of this distribution? TRACE the histogram, observe the probabilities and think on usual and unusual outcomes. 13) Construct the probability distribution for the binomial experiment with n = 12 and p = .9 Store the random variable into L1 (already done) Store the probabilities into L4. (See previous page for instructions) Use Plot 3 to graph the data stored into L1 and L4. (Turn off the other plots) What is the shape of this distribution? TRACE the histogram, observe the probabilities and think on usual and unusual outcomes. 14) Write your conclusions about the shape of a binomial probability histogram based on the value of p. If p < 0.5 the shape is If p = 0.5 the shape is If p > 0.5 the shape is Note: Do not clear the lists L1-L4. We’ll be using them in the next activity. 6


