SAS Output for Various Models
advertisement
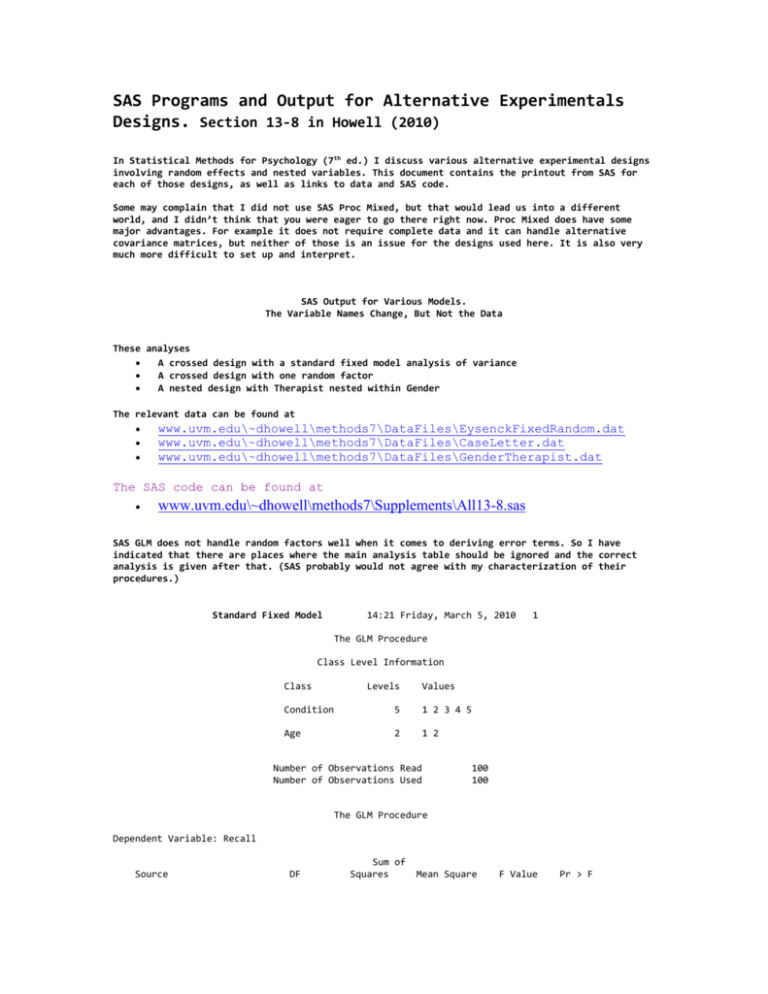
SAS Programs and Output for Alternative Experimentals Designs. Section 13-8 in Howell (2010) In Statistical Methods for Psychology (7th ed.) I discuss various alternative experimental designs involving random effects and nested variables. This document contains the printout from SAS for each of those designs, as well as links to data and SAS code. Some may complain that I did not use SAS Proc Mixed, but that would lead us into a different world, and I didn’t think that you were eager to go there right now. Proc Mixed does have some major advantages. For example it does not require complete data and it can handle alternative covariance matrices, but neither of those is an issue for the designs used here. It is also very much more difficult to set up and interpret. SAS Output for Various Models. The Variable Names Change, But Not the Data These analyses A crossed design with a standard fixed model analysis of variance A crossed design with one random factor A nested design with Therapist nested within Gender The relevant data can be found at www.uvm.edu\~dhowell\methods7\DataFiles\EysenckFixedRandom.dat www.uvm.edu\~dhowell\methods7\DataFiles\CaseLetter.dat www.uvm.edu\~dhowell\methods7\DataFiles\GenderTherapist.dat The SAS code can be found at www.uvm.edu\~dhowell\methods7\Supplements\All13-8.sas SAS GLM does not handle random factors well when it comes to deriving error terms. So I have indicated that there are places where the main analysis table should be ignored and the correct analysis is given after that. (SAS probably would not agree with my characterization of their procedures.) Standard Fixed Model 14:21 Friday, March 5, 2010 1 The GLM Procedure Class Level Information Class Levels Values Condition 5 1 2 3 4 5 Age 2 1 2 Number of Observations Read Number of Observations Used 100 100 The GLM Procedure Dependent Variable: Recall Source DF Sum of Squares Mean Square F Value Pr > F Model 9 1945.490000 216.165556 Error 90 722.300000 8.025556 Corrected Total 99 2667.790000 26.93 R-Square Coeff Var Root MSE Recall Mean 0.729252 24.40087 2.832941 11.61000 Source <.0001 DF Type III SS Mean Square F Value Pr > F 1 4 4 240.250000 1514.940000 190.300000 240.250000 378.735000 47.575000 29.94 47.19 5.93 <.0001 <.0001 0.0003 Age Condition Condition*Age Crossed Design with Random Factor Ignore the first part of this printout because it tests the wrong hypotheses. 14:21 Friday, March 5, 2010 The GLM Procedure Class Level Information Class Subj Levels 100 1 30 56 82 2 3 4 31 32 57 58 83 84 Values 5 6 7 33 34 59 60 85 86 8 9 10 11 12 13 14 15 16 17 18 19 20 21 22 23 24 25 26 27 28 29 35 36 37 38 39 40 41 42 43 44 45 46 47 48 49 50 51 52 53 54 55 61 62 63 64 65 66 67 68 69 70 71 72 73 74 75 76 77 78 79 80 81 87 88 89 90 91 92 93 94 95 96 97 98 99 100 Case 2 1 2 Letter 5 1 2 3 4 5 Number of Observations Read Number of Observations Used 101 100 The GLM Procedure Dependent Variable: ResponseTime Sum of Squares Source DF Model 99 2667.790000 Error 0 0.000000 99 2667.790000 Corrected Total R-Square Coeff Var 1.000000 Mean Square F Value 26.947374 Pr > F . . . Root MSE ResponseTime Mean . 11.61000 . Source DF Type III SS Mean Square Case Letter 1 4 240.250000 1514.940000 240.250000 378.735000 F Value . . Pr > F . . Case*Letter Case*Letter(Subj) Source 4 90 190.300000 722.300000 47.575000 8.025556 . . . . Type III Expected Mean Square Case Var(Error) + 10 Var(Case*Letter) + Q(Case,Case*Letter(Subj)) Letter Var(Error) + 10 Var(Case*Letter) + 20 Var(Letter) + Q(Case*Letter(Subj)) Case*Letter Var(Error) + 10 Var(Case*Letter) + Q(Case*Letter(Subj)) Case*Letter(Subj) Var(Error) + Q(Case*Letter(Subj)) The following are the correct tests The GLM Procedure Dependent Variable: ResponseTime Tests of Hypotheses Using the Type III MS for Case*Letter as an Error Term Source DF Type III SS Mean Square F Value Pr > F 1 240.2500000 240.2500000 5.05 0.0879 Case Tests of Hypotheses Using the Type III MS for Case*Letter(Subj) as an Error Term Source DF Type III SS Mean Square F Value Pr > F 4 4 1514.940000 190.300000 378.735000 47.575000 47.19 5.93 <.0001 0.0003 Letter Case*Letter Therapist Nested Within Gender 14:21 Friday, March 5, 2010 7 The GLM Procedure Class Level Information Class Levels Gender 2 Therapist 10 Values 1 2 1 2 3 4 5 6 7 8 9 10 Number of Observations Read Number of Observations Used 101 100 Ignore this analysis and look at the next one The GLM Procedure Dependent Variable: Effect Source DF Sum of Squares Mean Square F Value Pr > F Model 9 1945.490000 216.165556 26.93 <.0001 Error 90 722.300000 8.025556 Corrected Total 99 2667.790000 R-Square Coeff Var Root MSE Effect Mean 0.729252 24.40087 2.832941 11.61000 Source Gender Therapist(Gender) DF Type III SS Mean Square F Value Pr > F 1 8 240.250000 1705.240000 240.250000 213.155000 29.94 26.56 <.0001 <.0001 The GLM Procedure Source Type III Expected Mean Square Gender Var(Error) + 10 Var(Therapist(Gender)) + Q(Gender) Therapist(Gender) Var(Error) + 10 Var(Therapist(Gender)) Correct Analysis Tests of Hypotheses for Mixed Model Analysis of Variance Dependent Variable: Effect Source Gender DF 1 Type III SS 240.250000 Mean Square 240.250000 F Value 1.13 Pr > F 0.3194 Error 8 Error: MS(Therapist(Gender)) 1705.240000 213.155000 Source DF Type III SS Mean Square F Value Pr > F Therapist(Gender) 8 1705.240000 213.155000 26.56 <.0001 Error: MS(Error) 90 722.300000 8.025556


