Biol4090_Hw2
advertisement

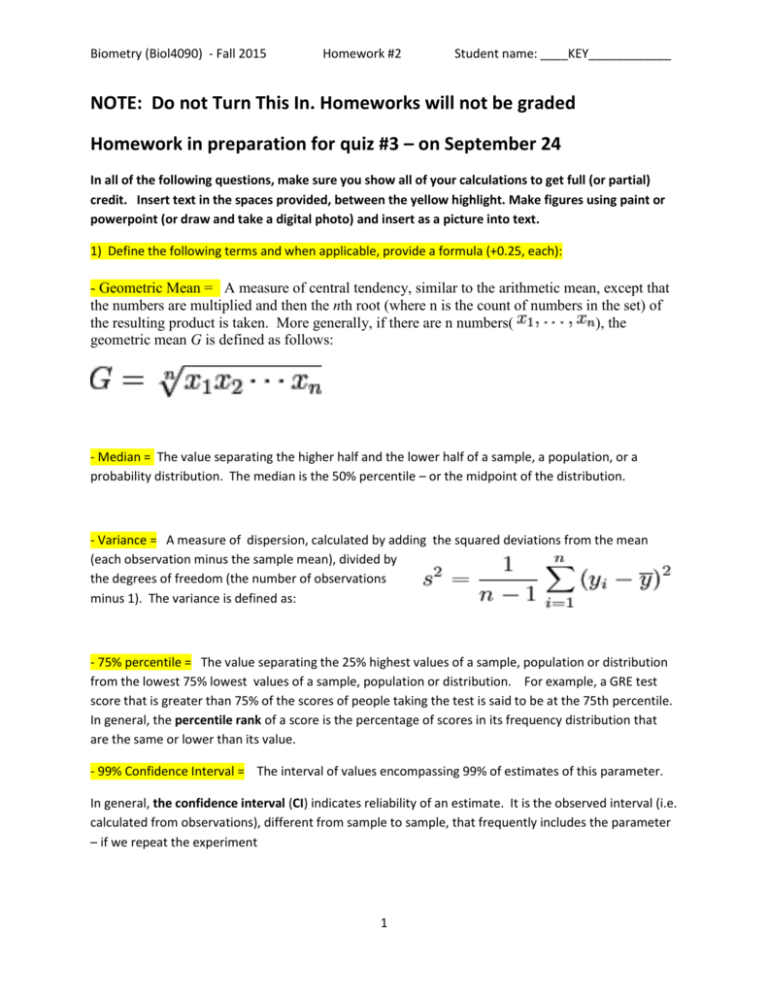
Biometry (Biol4090) - Fall 2015 Homework #2 Student name: ____KEY____________ NOTE: Do not Turn This In. Homeworks will not be graded Homework in preparation for quiz #3 – on September 24 In all of the following questions, make sure you show all of your calculations to get full (or partial) credit. Insert text in the spaces provided, between the yellow highlight. Make figures using paint or powerpoint (or draw and take a digital photo) and insert as a picture into text. 1) Define the following terms and when applicable, provide a formula (+0.25, each): - Geometric Mean = A measure of central tendency, similar to the arithmetic mean, except that the numbers are multiplied and then the nth root (where n is the count of numbers in the set) of the resulting product is taken. More generally, if there are n numbers( ), the geometric mean G is defined as follows: - Median = The value separating the higher half and the lower half of a sample, a population, or a probability distribution. The median is the 50% percentile – or the midpoint of the distribution. - Variance = A measure of dispersion, calculated by adding the squared deviations from the mean (each observation minus the sample mean), divided by the degrees of freedom (the number of observations minus 1). The variance is defined as: - 75% percentile = The value separating the 25% highest values of a sample, population or distribution from the lowest 75% lowest values of a sample, population or distribution. For example, a GRE test score that is greater than 75% of the scores of people taking the test is said to be at the 75th percentile. In general, the percentile rank of a score is the percentage of scores in its frequency distribution that are the same or lower than its value. - 99% Confidence Interval = The interval of values encompassing 99% of estimates of this parameter. In general, the confidence interval (CI) indicates reliability of an estimate. It is the observed interval (i.e. calculated from observations), different from sample to sample, that frequently includes the parameter – if we repeat the experiment 1 Biometry (Biol4090) - Fall 2015 Homework #2 Student name: ____KEY____________ 2) Using the portion of the Z-score table provided, calculate the following probabilities (+0.25 each) Show your work (reasoning) to get full credit: - P (Z >0.00) = __0.50000_ - P (Z <0.00) = __0.50000_ NOTE: Sum of both probabilities always equal 1 P ((Z<0.04) OR (Z>0.07))= _0.98805_ P(Z< 0.04) = 0.51595 (larger portion) P(Z> 0.07) = 0.47210 (smaller portion) - P ((Z<0.04) AND (Z>0.07))= ___0___ Note: This is impossible, no Z score can be both smaller than 0.04 and larger than 0.07 - P ((Z>0.04) AND (Z<0.07))= _0.01195_ P(Z> 0.04) = 0.48405 (smaller portion) P(Z< 0.07) = 0.52790 (larger portion) 0.52790 + 0.48405 = 1.01195 Shared probability equal to P (0.04 < Z <0.07) NOTE: Complementary probability of P ((Z<0.04) OR (Z>0.07))= 0.98805 To check: 0.01195 + 0.98805 = 1 - P ((Z>0.04) AND (Z>0.07))= _0.47210_ - P(Z> 0.07) = 0.47210 (smaller portion) NOTE: Since Z needs is larger than both 0.04 and 0.07, this is the same probability as P (Z>0.07). 2 Biometry (Biol4090) - Fall 2015 Homework #2 Student name: ____KEY____________ 3) Adult males in a certain country are known to have heights, which are normally distributed with a mean of 175.6 cm and a SD of 7.63 cm. If you select an adult male from this population at random, what is the probability that: (i) his height lies between 175 and 185 cm, and (ii) if you select 6 males from this population at random, at least 4 will have heights between 175 and 185 cm? (+0.25 each) Note, for this question, you will need to use the Z-score table in Appendix 1 of your textbook. Mean = 175.6 SD = 7.63 (i) - step 1: convert the two values delineating the range (175 and 185) into Z scores: Z1 = (175 – 175.6) / 7.63 = -0.07864 Z2 = (185 – 175.6) / 7.63 = +1.231979 - step 2: calculate probabilities using calculated Z scores with Z-score table in Appendix 1 of Field text. Note: you need to round off the Z scores to two significant digits. So, we will calculate the following: P (-0.08 < Z < +1.23) P (-0.08 < Z) : NOTE: the table only shows the positive pat of the curve. Therefore, to use the table, we need to figure out what portion of the curve (the larger or the smaller) we need to use. We have to use the large portion of the curve. From the Table, using Z = 0.08, the probability is equal to 0.53188 P (Z < +1.23): We can calculate this probability directly from the Z score table, using the larger portion of the curve. From the Table, using Z = 1.23, the probability is equal to 0.89065 When we add both probabilities, the result is larger than 1, because there is an area of overlap. 0.53188 + 0.89065 = 1.42253 Now, to figure out the area of overlap, we can subtract 1 to the sum of the two probabilities: P (-0.08 < Z < +1.23) = 1.42253 – 1 = 0.42253 NOTE: You can also calculate this probability as follows: P (-0.08 < Z < +1.23) = 1 – ((P (Z > +1.23)) – ((P (Z < -0.08)) P (-0.08 > Z) : (use the small proportion) = 0.46812 P (Z > +1.23) : (use the small proportion) = 0.10935 So, P (-0.08 > Z < +1.23) = 1 - 0.46812 - 0.10935 = 0.42253 3 Biometry (Biol4090) - Fall 2015 Homework #2 Student name: ____KEY____________ (ii) Pick 6 males (n = 6), at least 4 are in this size range (this is what we are calling a success) P (165 < Z < 175) = P(success) = 0.42253 P(failure) = 1 - 0.42253 = 0.57747 How can we get at least 4 successes in 6 trials: get 4 successes + get 5 successes + get 6 successes Probability of getting 6 successes = 0.00569 * 1 = 0.00569 - P (6 successes) = 0.42253 ^ 6 - Permutations: 6! / 6! 0! = 1 (only one way to shuffle six successes) Probability of getting 5 successes = 0.007777 * 6 = 0.046663 - P (5 successes) = (0.42253 ^ 5) * ( 0.57747 ^ 1) - Permutations: 6! / 5! 1! = 6 (six ways to shuffle five successes) Probability of getting 4 successes = 0.010629 * 15 = 0.159435 - P (4 successes) = (0.42253 ^ 4) * (0.57747 ^ 2) - Permutations: 6! / 4! 2! = 6 * 5 / 2 = 15 (fifteen ways to shuffle four successes) Probability = 0.00569 + 0.046663 + 0.159435 = 0.211788 4) You randomly sample 100 cats in O’ahu and measured their tails. The mean tail length = 19.8 cm and the S.D. = 4.8 cm. Calculate the following parameters using these data (+0.25 each): - Coefficient of Variation (CV): Definition = (S.D. * 100 ) / Mean = 480 / 19.8 = 24.24 % - Standard Error (S.E.): Definition = = S.D. / sqrt (n) = 4.8 / 10 = 0.48 - 96% Confidence Interval (CI): Note: 96% of data within mean +/- 2 S.D. lower CI = mean - S.E. * Zscore 19.8 – (0.48 * 2) upper CI = mean + S.E. * Zscore 19.8 + (0.48 * 2) 96% CI = 18.8 +/- 0.96 = from 18.84 to 20.76 4 Biometry (Biol4090) - Fall 2015 Homework #2 Student name: ____KEY____________ - 68% Confidence Interval (CI): Note: 68% of data within mean +/- 1 S.D. lower CI = mean - S.E. * Zscore 19.8 – (0.48 * 1) upper CI = mean + S.E. * Zscore 19.8 + (0.48 * 1) 96% CI = 18.8 +/- 0.48 = from 19.32 to 20.28 5) Report the following parameters for these samples: median, mode, mean, S.D., variance. Show all of your work to get full (partial) credit: (+0.1 each parameter): Dataset a: 1,2,3,4,5 Median: 3 (two values are larger and two values are smaller) Mode: There is no mode. All five values are equally frequent. Mean: Sum of values (1+2+3+4+5) and divide by the number of samples (5) = 15 / 5 = 3 S.D.: The square root of the variance. Sqrt (2.5) = 1.58 Variance: Sum of the squared deviations, divided by the degrees of freedom (4). = [ (1-3) ^2 + (2-3) ^2 + (3-3) ^2 + (4-3) ^ 2 + (5-3) ^2 ] / 4 = ( 4 + 1 + 0 + 1 + 4) / 4 = 10 / 4 = 2.5 Dataset b: 3,3,3,3,3 Median: 3 (All values are the same) Mode: The mode is 3. This is the most frequent value. Mean: Sum of values (3+3+3+3+3) and divide by the number of samples (5) = 15 / 5 = 3 S.D.: The square root of the variance. Sqrt (0) = 0 Variance: Sum of the squared deviations, divided by the degrees of freedom (4). = [ (3-3)^2 + (3-3) ^ 2 + (3-3) ^2 + (3-3) ^ 2 + (3-3) ^2 ] / 4 = ( 0+0+0+0) / 4 = 0 / 4 = 0 5


