b) the hypothesis test used (normal curv
advertisement

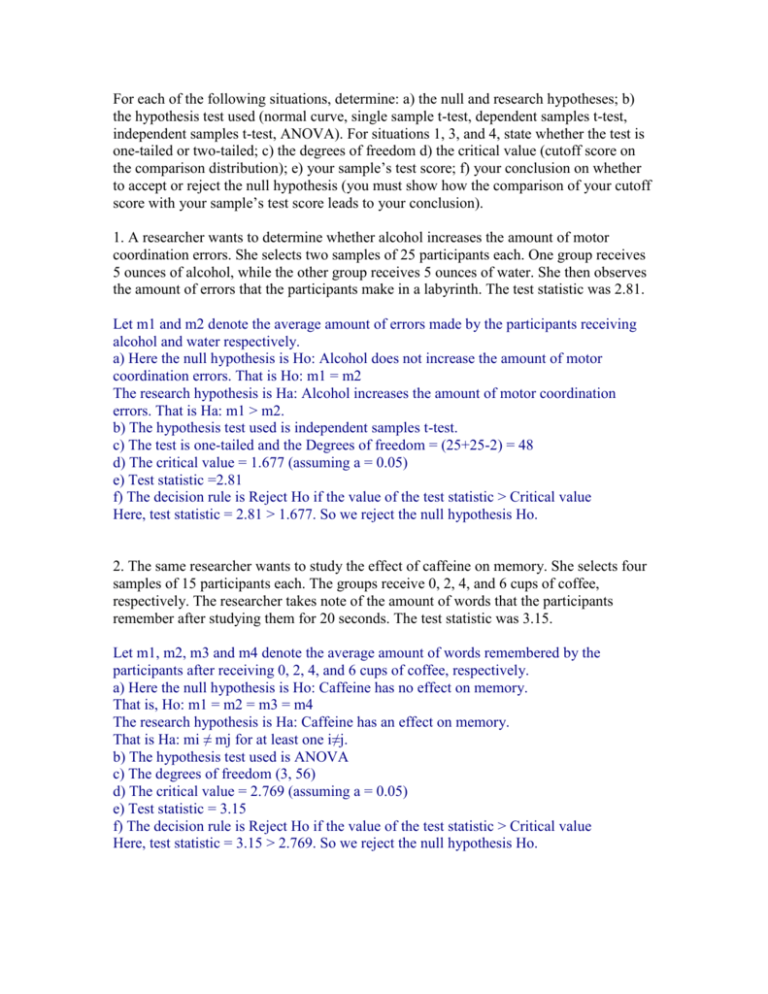
For each of the following situations, determine: a) the null and research hypotheses; b) the hypothesis test used (normal curve, single sample t-test, dependent samples t-test, independent samples t-test, ANOVA). For situations 1, 3, and 4, state whether the test is one-tailed or two-tailed; c) the degrees of freedom d) the critical value (cutoff score on the comparison distribution); e) your sample’s test score; f) your conclusion on whether to accept or reject the null hypothesis (you must show how the comparison of your cutoff score with your sample’s test score leads to your conclusion). 1. A researcher wants to determine whether alcohol increases the amount of motor coordination errors. She selects two samples of 25 participants each. One group receives 5 ounces of alcohol, while the other group receives 5 ounces of water. She then observes the amount of errors that the participants make in a labyrinth. The test statistic was 2.81. Let m1 and m2 denote the average amount of errors made by the participants receiving alcohol and water respectively. a) Here the null hypothesis is Ho: Alcohol does not increase the amount of motor coordination errors. That is Ho: m1 = m2 The research hypothesis is Ha: Alcohol increases the amount of motor coordination errors. That is Ha: m1 > m2. b) The hypothesis test used is independent samples t-test. c) The test is one-tailed and the Degrees of freedom = (25+25-2) = 48 d) The critical value = 1.677 (assuming a = 0.05) e) Test statistic =2.81 f) The decision rule is Reject Ho if the value of the test statistic > Critical value Here, test statistic = 2.81 > 1.677. So we reject the null hypothesis Ho. 2. The same researcher wants to study the effect of caffeine on memory. She selects four samples of 15 participants each. The groups receive 0, 2, 4, and 6 cups of coffee, respectively. The researcher takes note of the amount of words that the participants remember after studying them for 20 seconds. The test statistic was 3.15. Let m1, m2, m3 and m4 denote the average amount of words remembered by the participants after receiving 0, 2, 4, and 6 cups of coffee, respectively. a) Here the null hypothesis is Ho: Caffeine has no effect on memory. That is, Ho: m1 = m2 = m3 = m4 The research hypothesis is Ha: Caffeine has an effect on memory. That is Ha: mi ≠ mj for at least one i≠j. b) The hypothesis test used is ANOVA c) The degrees of freedom (3, 56) d) The critical value = 2.769 (assuming a = 0.05) e) Test statistic = 3.15 f) The decision rule is Reject Ho if the value of the test statistic > Critical value Here, test statistic = 3.15 > 2.769. So we reject the null hypothesis Ho. 3. Suppose that previous studies have found that the mean amount of sessions necessary to “cure” depressive patients using a particular therapeutic model is 25 sessions, with a standard deviation (s) of 4. A new model is introduced, and you want to determine whether the amount of sessions needed to “cure” depressive patients with this new model is significantly lower than 25. You select 40 patients, all of whom receive therapy using the new model. You keep track of the amount of sessions these participants take to become “cured”. The test statistic was -3.90. Let m denote the average amount of sessions needed to “cure” depressive patients . a) Here the null hypothesis is Ho: m = 25 The research hypothesis is Ha: m < 25 b) The hypothesis test used is single sample test using normal curve. c) Here no degrees of freedom since we are using normal curve. d) The critical value = -1.645 (assuming a = 0.05) e) Test statistic = -3.90 f) The decision rule is Reject Ho if the value of the test statistic < Critical value Here, test statistic = -3.90 < -1.645. So we reject the null hypothesis Ho. 4. An industrial/organizational psychologist is interested in determining whether adding 15-minute breaks increases worker productivity. She selects a sample of 20 participants and measures their productivity before and after introducing the 15-minute breaks. The test statistic was -3.15. Let m1 and m2 denote the average productivity before and after introducing the 15minute breaks respectively. a) Here the null hypothesis is Ho: Adding 15-minute breaks does not increase worker productivity. That is Ho: m1 = m2 The research hypothesis is Ha: Adding 15-minute breaks increases worker productivity. That is Ha: m1 < m2. b) The hypothesis test used is dependent samples t-test. c) The test is one-tailed and the Degrees of freedom = (20-1) = 19 d) The critical value = -1.729 (assuming a = 0.05) e) Test statistic = -3.15 f) The decision rule is Reject Ho if the value of the test statistic < Critical value Here, test statistic = -3.15 < -1.729. So we reject the null hypothesis Ho.


