PS5 Solution
advertisement
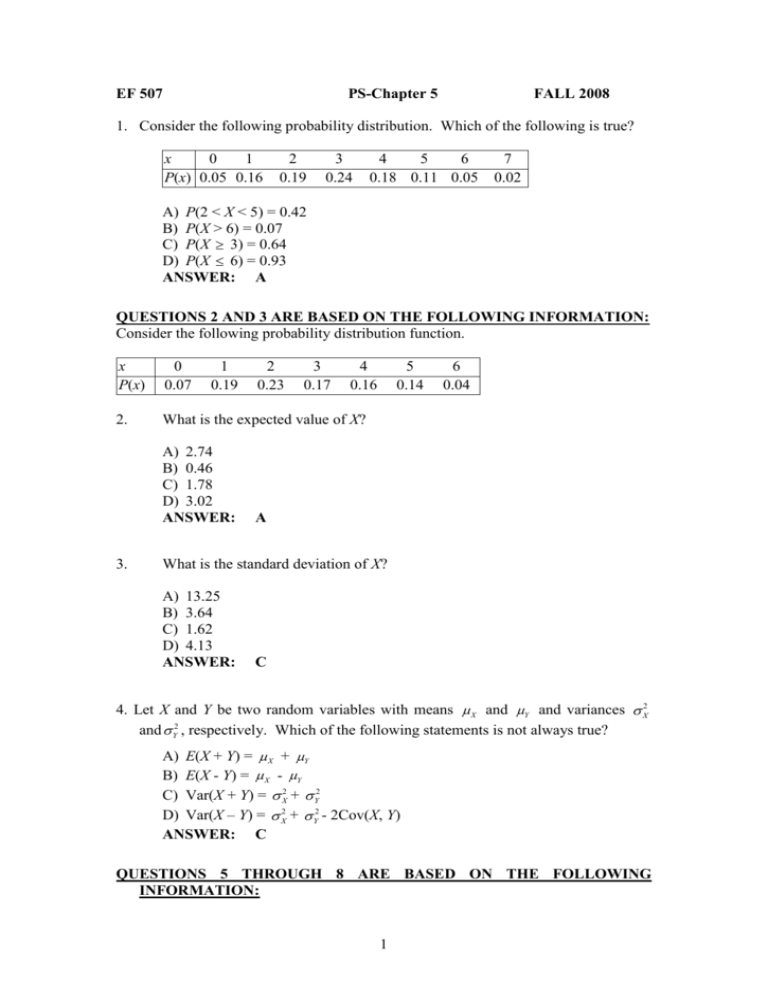
EF 507 PS-Chapter 5 FALL 2008 1. Consider the following probability distribution. Which of the following is true? x 0 1 P(x) 0.05 0.16 2 0.19 3 0.24 4 5 6 0.18 0.11 0.05 7 0.02 A) P(2 < X < 5) = 0.42 B) P(X > 6) = 0.07 C) P(X 3) = 0.64 D) P(X 6) = 0.93 ANSWER: A QUESTIONS 2 AND 3 ARE BASED ON THE FOLLOWING INFORMATION: Consider the following probability distribution function. x P(x) 0 0.07 1 0.19 2. What is the expected value of X? A) 2.74 B) 0.46 C) 1.78 D) 3.02 ANSWER: 3. 2 0.23 3 0.17 4 0.16 5 0.14 6 0.04 A What is the standard deviation of X? A) 13.25 B) 3.64 C) 1.62 D) 4.13 ANSWER: C 4. Let X and Y be two random variables with means X and Y and variances X2 and Y2 , respectively. Which of the following statements is not always true? A) E(X + Y) = X + Y B) E(X - Y) = X - Y C) Var(X + Y) = X2 + Y2 D) Var(X – Y) = X2 + Y2 - 2Cov(X, Y) ANSWER: C QUESTIONS 5 THROUGH 8 ARE BASED ON THE FOLLOWING INFORMATION: 1 On average, you receive 2.6 pieces of junk mail a day. Assume that the number of pieces of junk mail you receive each day follows the Poisson distribution. 5. What is the probability that you receive exactly three pieces of junk mail today? A) 0.198 B) 0.233 C) 0.218 D) 0.176 ANSWER: C 6. What is the probability of receiving more than three pieces of junk mail today? A) 0.123 B) 0.264 C) 0.482 D) 0.242 ANSWER: B 7 What is the standard deviation of the number of pieces of junk mail you receive daily? A) 1.61 B) 2.60 C) 6.76 D) There is not sufficient information to determine this. ANSWER: A 8. What is the expected number of pieces of junk mail you receive daily? A) 6.76 B) 1.61 C) 3.22 D) 2.60 ANSWER: D 9. The following table displays the joint probability distribution of X and Y. What is the covariance between the X and Y? 0 Y 1 2 A) 0.29 B) 0.23 C) 0.25 D) 0.21 ANSWER: 0 0.13 0.16 0.07 X 1 0.08 0.14 0.04 2 0.021 0.03 0.13 A 2 10. Generally speaking, if two variables are unrelated (as one increases, the other shows no pattern), the covariance between the variables will be A) a large positive number. B) a large negative number. C) a positive or negative number close to zero. D) None of the above. ANSWER: C 11. Which of the following is an example of a binomial experiment? A) A shopping mall is interested in the income level of its customers and is taking a survey to gather information. B) A business firm introducing a new product wants to know how many purchases its clients will make each year. C) A sociologist is researching an area in an effort to determine the proportion of households with a male head of household. D) A study is concerned with the average number of hours worked by high school students. ANSWER: C 12. If X and Y are random variables with Var(X) = 7.5, Var(Y) = 6 and Cov(X,Y) = 4, then Var(2X+3Y) is: A) 132. B) 37. C) 88. D) 33. ANSWER: A 13. Which of the following identities is true If X and Y are independent random variables? A) E(2X+3Y) = E(X) + E(Y) + 5 B) Var(2X+3Y) =2Var(X) + 3Var(Y) C) Var(2X+3Y) = 4Var(X) + 9Var(Y) D) E(2X+3Y) = 5E(X+Y) ANSWER: C 14. Consider the following probability distribution function. Compute the mean and standard deviation of x. x P(x) 0 0.05 1 0.16 2 0.19 3 0.24 4 0.18 5 0.11 6 0.05 ANSWER: X xP( x) 2.97 x x 2 P( x) X2 11.49 (2.97)2 2.6691 ; hence x 1.6337 2 X x 3 7 0.02 15. In a box of 16 chocolates, there are four chocolates with coconut filling. What is the probability of choosing four chocolates, one or more of which have coconut filling? ANSWER: 20 = 4845. 4 Total number of combinations of four chocolates out of 20= Number of ways of choosing four chocolates none of which have 16 4 1820. 4 0 coconut= Let X = Number of chocolates which have coconut filling. Since P(X = 0) =1820 / 4845 = 0.376, then P(X 1) = 1-P(X = 0) =1- 0.376 = 0.624. QUESTIONS 16 AND 17 ARE BASED ON THE FOLLOWING INFORMATION: The following table displays the joint probability distribution of X and Y. 0 0.09 0.16 0.07 X 1 0.08 0.14 0.16 2 0.23 0.05 0.02 Y 1 2 3 16. Find and interpret the conditional probability function of X, given Y = 1. ANSWER: The conditional probability function of X, given Y =1 is given by P(X =x |Y =1). Since P(X = x |Y = 1) = P(X = x Y =1) / P(Y =1). Hence, P(X = 0 | Y =1) = 0.09 / 0.40 = 0.225, P(X = 1 | Y = 1) = 0.08 / 0.40 = 0.20, and P(X = 2 |Y = 1) = 0.23 / 0.40 = 0.575. This means that if we know Y = 1, then we know that the probability X equals zero is 0.225, the probability X equals one is 0.20, and that the probability X equals two is 0.575. 17. Are X and Y statistically independent? Explain ANSWER: Since, P(X = 0) = 0.32, P(Y = 1) = 0.4, and P(X = 0 Y = 1) = 0.09 P(X = 0) P(Y = 1), then X and Y are not statistically independent. 4 QUESTIONS 18 THROUGH 28 ARE BASED ON THE FOLLOWING INFORMATION: The following table displays the joint probability distribution of two discrete random variables X and Y. What is the covariance between X and Y? Y 18. 1 0.10 0.05 0.02 0 1 2 X 2 0.12 0.10 0.16 3 0.06 0.11 0.28 Determine the marginal probability distribution for X. ANSWER: x P(x) 19. 1 2 3 0.17 0.38 0.45 Compute the expected value for X. ANSWER: X x P x 2.28 20. Compute the standard deviation for X. ANSWER: X2 x 2 P x X2 5.74 2.28 0.5416 . Hence, X =0.7359. 2 21. Determine the marginal probability distribution for Y. ANSWER: y P(y) 22. 0 1 2 0.28 0.26 0.46 Compute the expected value for Y. ANSWER: Y y P y 1.18 23. Compute the standard deviation for Y. ANSWER: Y2 y 2 P y Y2 2.10 1.18 0.7076 . Hence, Y 0.8412 . 2 24. Compute the covariance between X and Y. ANSWER: Cov(X, Y)= xyP x, y X Y =2.94-(2.28)(1.18)=0.2496 x y 5 25. Compute the correlation between X and Y. ANSWER: = Corr(X, Y) = 26. Cov x, y X Y 0.2496 0.4032 0.7359 0.8412 Compute the mean for the linear function W =2X+Y. ANSWER: W 2 X Y =2(2.28)+1.18 = 5.74 27. Compute the variance for the linear function W = 2X+Y. ANSWER: W2 2 X2 1 Y2 +2(2)(1)Cov(X, Y) = 4(0.5416) + 0.7076 + 4(0.2496) = 2 2 3.8724 28. Are X and Y statistically independent? Explain. ANSWER: The variables X and Y are not statistically independent since P(X=1) = 0.17, P(Y = 0) = 0.28, and P(X =1 and Y = 0) = 0.10 P(X = 1) P(Y = 0). QUESTIONS 29 THROUGH 33 ARE BASED ON THE FOLLOWING INFORMATION: From past experience, it is known 90% of one-year-old children can distinguish their mother's voice from the voice of a similar sounding female. A random sample of 20 one-year-olds is given this voice recognition test. 29. Find the probability at least 3 children do not recognize their mother's voice. ANSWER: P(X 3 ) = 0.323 30. Find the probability all 20 children recognize their mother's voice. ANSWER: P(X = 20) = 0.122 31. (Here p = 0.10) (Here p = 0.90) Let the random variable X denote the number of children who do not recognize their mother's voice. Find the mean of X. ANSWER: = nP = 2 32. Let the random variable X denote the number of children who do not recognize their mother's voice. Find the variance of X. ANSWER: 6 2 nP(1 P) = 1.8 33. Find the probability that at most 4 children do not recognize their mother’s voice? ANSWER: P(X 4) = 0.957 (Here p = 0.10) QUESTIONS 34 THROUGH 37 ARE BASED ON THE FOLLOWING INFORMATION: The quality of computer disks is measured by sending the disks through a certifier which counts the number of missing pulses. A certain brand of computer disks averages 0.1 missing pulse per disk. Let the random variable X denote the number of missing pulses. 34. What is the distribution of X? ANSWER: X has a Poisson distribution with mean 0.1. 35. Find the probability the next inspected disk will have no missing pulse. ANSWER: P(X = 0) = 0.905 36. Find the probability the next disk inspected will have more than one missing pulse. ANSWER: P(X> 1) = 0.005 37. Find the probability neither of the next two disks inspected will contain any missing pulse. ANSWER: We can assume the disks are independent. P(X = 0 on first disk and x = 0 on second disk) = P(X = 0).P(X = 0) = (0.905)2 = 0.819 QUESTIONS 38 THROUGH 41 ARE BASED ON THE FOLLOWING INFORMATION: The number of people arriving at a bicycle repair shop follows a Poisson distribution with an average of 5 arrivals per hour. Let x represent number of people arriving per hour) 38. What is the probability that seven people arrive at the bike repair shop in a one hour period of time? ANSWER: 7 P(X = 7) = 39. e 5 57 = 0.1044 or P(X 7) - P(X 6) = 0.867 - 0.762 = 0.105 7! What is the probability that at most seven people arrive at the bike repair shop in a one hour period of time? ANSWER: P(X 7) = 0.867 40. What is the probability that more than seven people arrive at the bike repair shop in a one hour period of time? ANSWER: P(X > 7) = 1 - P(X 7) = 1 - 0.867 = 0.133 41. What is the probability that between 4 and 9 people, inclusively, arrive at the bike repair shop in a one hour period of time? ANSWER: P(4 X 9) = P(X 9) - P(X 3) = 0.968 - 0.265 = 0.703 QUESTIONS 42 THROUGH 49 ARE BASED ON THE FOLLOWING INFORMATION: A small grocery store has two checkout lines available to its customers: a regular checkout line and an express checkout line. Customers with 5 or fewer items are expected to use the express line. Let X and Y be the number of customers in the regular checkout line and the express checkout line, respectively. Note that these numbers include the customers being served, if any. The joint probability distribution is given in the table below. X=0 X=1 X=2 X 3 42. Y=0 0.06 0.09 0.08 0.07 Y=1 0.04 0.06 0.05 0.05 Y=2 0.03 0.03 0.01 0.03 Y 3 0.15 0.04 0.12 0.09 Find the marginal distribution of X. What does this distribution tell you? ANSWER: The marginal distribution of X is: P( X 0) 0.28, P( X 1) 0.22, P( X 2) 0.26, P( X 3) 0.24 This distribution indicates the likelihood of observing a particular number of customers in the regular checkout line. 43. Find the marginal distribution of Y. What does this distribution tell you? ANSWER: The marginal distribution of Y is: 8 P(Y 0) 0.30, P(Y 1) 0.20, P(Y 2) 0.10, P(Y 3) 0.40 This distribution indicates the likelihood of observing a particular number of customers in the express checkout line. 44. Calculate the conditional distribution of X given Y. ANSWER: The Conditional distribution of X given Y is: X=0 X=1 X=2 X 3 45. Y=0 0.200 0.300 0.267 0.233 1.00 Y=1 0.200 0.300 0.250 0.250 1.00 Y=2 0.300 0.300 0.100 0.300 1.00 Y 3 0.375 0.100 0.300 0.225 1.00 What is the practical benefit of knowing the conditional distribution in Question 44? ANSWER: If we find that the probability that customers are waiting in the regular line when the express line is empty is relatively large, we might permit some customers in the regular line to switch to the express line when it is empty. Conversely, if we learn that the probability that no customers are waiting in the regular line when the express line is busy is relatively large, we might then encourage express line customers to switch to the idle regular line. The idea here is to reduce the average waiting time of the customers. 46. What is the probability that no one is waiting or being served in the regular checkout line? ANSWER: P(Regular line is empty) = P(X = 0) = 0.28 47. What is the probability that no one is waiting or being served in the express checkout line? ANSWER: P(Express line is empty) = P(Y = 0) = 0.30 48. What is the probability that no more than two customers are waiting in both lines combined? ANSWER: P(Number in regular line + Number in express line 2) = P( X 0, Y 0) P( X 0, Y 1) P( X 0, Y 2) P( X 1, Y 0) P( X 1, Y 1) P( X 2, Y 0) 0.36 49. On average, how many customers would you expect to see in each of these two lines at the grocery store? ANSWER: Expected number of customers in regular line = E(X) = 1.60 Expected number of customers in express line = E(Y) = 1.60 9
