Simulation of ultrasound transducer fields and ultrasound imaging
advertisement
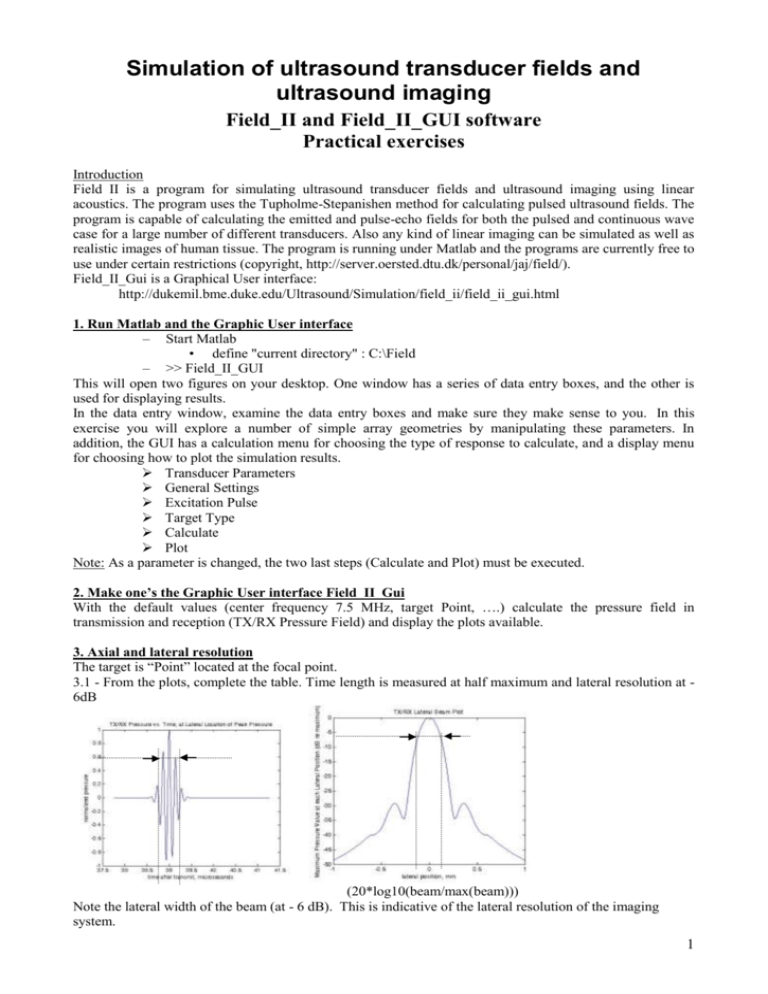
Simulation of ultrasound transducer fields and ultrasound imaging Field_II and Field_II_GUI software Practical exercises Introduction Field II is a program for simulating ultrasound transducer fields and ultrasound imaging using linear acoustics. The program uses the Tupholme-Stepanishen method for calculating pulsed ultrasound fields. The program is capable of calculating the emitted and pulse-echo fields for both the pulsed and continuous wave case for a large number of different transducers. Also any kind of linear imaging can be simulated as well as realistic images of human tissue. The program is running under Matlab and the programs are currently free to use under certain restrictions (copyright, http://server.oersted.dtu.dk/personal/jaj/field/). Field_II_Gui is a Graphical User interface: http://dukemil.bme.duke.edu/Ultrasound/Simulation/field_ii/field_ii_gui.html 1. Run Matlab and the Graphic User interface – Start Matlab • define "current directory" : C:\Field – >> Field_II_GUI This will open two figures on your desktop. One window has a series of data entry boxes, and the other is used for displaying results. In the data entry window, examine the data entry boxes and make sure they make sense to you. In this exercise you will explore a number of simple array geometries by manipulating these parameters. In addition, the GUI has a calculation menu for choosing the type of response to calculate, and a display menu for choosing how to plot the simulation results. Transducer Parameters General Settings Excitation Pulse Target Type Calculate Plot Note: As a parameter is changed, the two last steps (Calculate and Plot) must be executed. 2. Make one’s the Graphic User interface Field_II_Gui With the default values (center frequency 7.5 MHz, target Point, ….) calculate the pressure field in transmission and reception (TX/RX Pressure Field) and display the plots available. 3. Axial and lateral resolution The target is “Point” located at the focal point. 3.1 - From the plots, complete the table. Time length is measured at half maximum and lateral resolution at 6dB (20*log10(beam/max(beam))) Note the lateral width of the beam (at - 6 dB). This is indicative of the lateral resolution of the imaging system. 1 Axial resolution = Time length * 1540m/s 2 MHz Center Frequency 5 MHz 10 MHZ Period of the transmitted signal Time length of the transmitted signal Axial Resolution Lateral Resolution 3.2 – Corroborate the lateral resolution and axial resolution measurements with a new simulation: target «structured » (2 points in axial direction and 2 points in lateral direction, distance between targets 0.5 mm) for the same frequencies. 3.3 - Move the targets out of the focal point. Observe the change in resolutions. 3.4 – Change the excitation pulse. Is there some change in the resolutions? 4. Focalised beam Chose a target structured : 10 axial points, distance between axial points 1 mm, 1 lateral point. The central frequency is 5 MHz and the lateral ROI is 5 mm. Observe the spatial differences of the point spread function with a linear probe made of 16, 64 and 128 elements. In the latter case, compare the images obtained with a central frequency of 2, 5 and 10 MHz 5. Diffuse scattering Generation of an image including a hypoechoic cyst and structured scatterers Number of element 64 Frequency: 5 MHz Sampling Frequency: 25 MHz, Lateral ROI range: 8 mm Lateral increment: 0.1 mm Target type: structured and diffuse Number of axial points: 3 Distance between axial points: 0. 5 mm Number of lateral points: 3 Distance between lateral points: 0. 5 mm Diffuse ROI size: 8 mm Diffuse scatterer density: 5 Amplitude ratio: 10 Evaluation of the processing time – Storage of the resulting image Change the scatterers density : 10, 2 – comparison of the processing time and image aspects 6. Try yourself 2
