STRUCTURAL CHANGES STUDIES OF a
advertisement
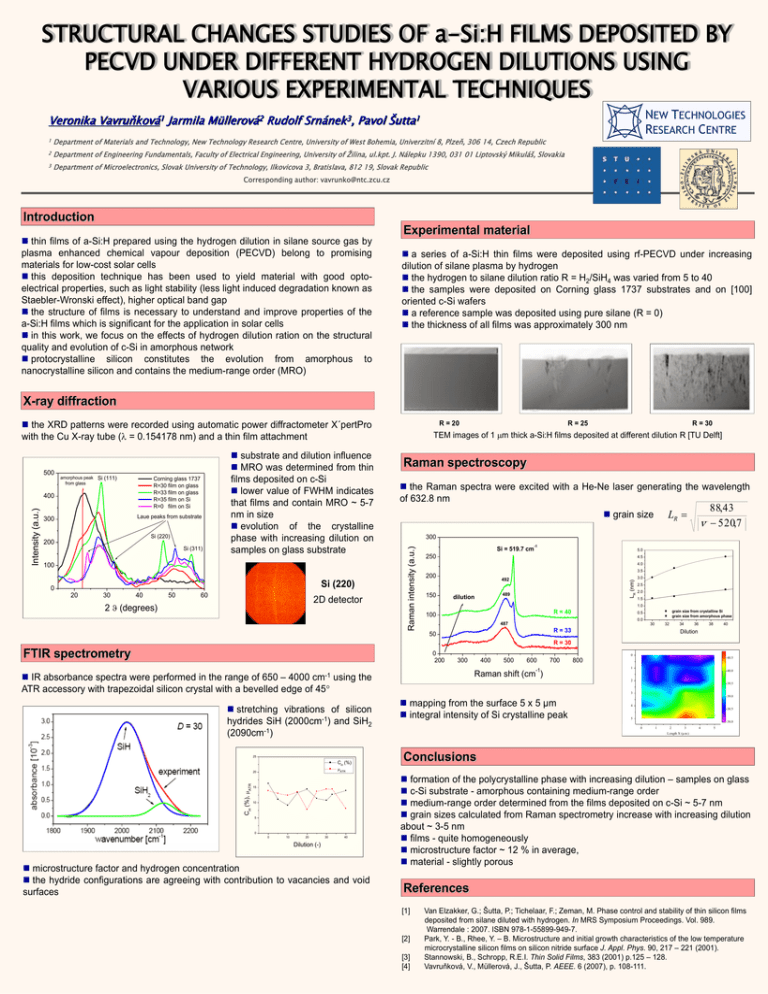
STRUCTURAL CHANGES STUDIES OF a-Si:H FILMS DEPOSITED BY PECVD UNDER DIFFERENT HYDROGEN DILUTIONS USING VARIOUS EXPERIMENTAL TECHNIQUES Veronika Vavruňková1 Jarmila Müllerová2 Rudolf Srnánek3, Pavol Šutta1 1 Department of Materials and Technology, New Technology Research Centre, University of West Bohemia, Univerzitní 8, Plzeň, 306 14, Czech Republic 2 Department of Engineering Fundamentals, Faculty of Electrical Engineering, University of Žilina, ul.kpt. J. Nálepku 1390, 031 01 Liptovský Mikuláš, Slovakia 3 Department of Microelectronics, Slovak University of Technology, Ilkovicova 3, Bratislava, 812 19, Slovak Republic Corresponding author: vavrunko@ntc.zcu.cz Introduction thin films of a-Si:H prepared using the hydrogen dilution in silane source gas by plasma enhanced chemical vapour deposition (PECVD) belong to promising materials for low-cost solar cells this deposition technique has been used to yield material with good optoelectrical properties, such as light stability (less light induced degradation known as Staebler-Wronski effect), higher optical band gap the structure of films is necessary to understand and improve properties of the a-Si:H films which is significant for the application in solar cells in this work, we focus on the effects of hydrogen dilution ration on the structural quality and evolution of c-Si in amorphous network protocrystalline silicon constitutes the evolution from amorphous to nanocrystalline silicon and contains the medium-range order (MRO) Experimental material a series of a-Si:H thin films were deposited using rf-PECVD under increasing dilution of silane plasma by hydrogen the hydrogen to silane dilution ratio R = H2/SiH4 was varied from 5 to 40 the samples were deposited on Corning glass 1737 substrates and on [100] oriented c-Si wafers a reference sample was deposited using pure silane (R = 0) the thickness of all films was approximately 300 nm X-ray diffraction the XRD patterns were recorded using automatic power diffractometer X´pertPro with the Cu X-ray tube ( = 0.154178 nm) and a thin film attachment Si (111) Corning glass 1737 R=30 film on glass R=33 film on glass R=35 film on Si R=0 film on Si Intensity (a.u.) 400 Laue peaks from substrate 300 Si (220) 200 Si (311) 100 Si (220) 0 20 30 40 50 60 2D detector 2 (degrees) R = 30 Raman spectroscopy the Raman spectra were excited with a He-Ne laser generating the wavelength of 632.8 nm 88,43 520,7 LR grain size 300 Si = 519.7 cm -1 5.0 250 4.5 4.0 3.5 200 150 492 LR (nm) amorphous peak from glass R = 25 TEM images of 1 m thick a-Si:H films deposited at different dilution R [TU Delft] Raman intensity (a.u.) 500 substrate and dilution influence MRO was determined from thin films deposited on c-Si lower value of FWHM indicates that films and contain MRO ~ 5-7 nm in size evolution of the crystalline phase with increasing dilution on samples on glass substrate R = 20 489 dilution 3.0 2.5 2.0 1.5 1.0 R = 40 100 grain size from crystalline Si grain size from amorphous phase 0.5 0.0 487 30 32 34 R = 33 50 36 38 40 Dilution R = 30 FTIR spectrometry 0 200 0 300 25 CH (%) 600 700 40.5 800 1 40.0 Raman shift (cm ) 2 39.5 3 mapping from the surface 5 x 5 μm integral intensity of Si crystalline peak 39.0 4 38.5 0.5 µm 5 38.0 0 1 2 3 4 5 Length X (µm ) Conclusions ATR 20 CH (%), ATR 500 -1 IR absorbance spectra were performed in the range of 650 – 4000 cm-1 using the ATR accessory with trapezoidal silicon crystal with a bevelled edge of 45 stretching vibrations of silicon hydrides SiH (2000cm-1) and SiH2 (2090cm-1) 400 15 10 5 0 0 10 20 30 40 Dilution (-) microstructure factor and hydrogen concentration the hydride configurations are agreeing with contribution to vacancies and void surfaces formation of the polycrystalline phase with increasing dilution – samples on glass c-Si substrate - amorphous containing medium-range order medium-range order determined from the films deposited on c-Si ~ 5-7 nm grain sizes calculated from Raman spectrometry increase with increasing dilution about ~ 3-5 nm films - quite homogeneously microstructure factor ~ 12 % in average, material - slightly porous References [1] [2] [3] [4] Van Elzakker, G.; Šutta, P.; Tichelaar, F.; Zeman, M. Phase control and stability of thin silicon films deposited from silane diluted with hydrogen. In MRS Symposium Proceedings. Vol. 989. Warrendale : 2007. ISBN 978-1-55899-949-7. Park, Y. - B., Rhee, Y. – B. Microstructure and initial growth characteristics of the low temperature microcrystalline silicon films on silicon nitride surface J. Appl. Phys. 90, 217 – 221 (2001). Stannowski, B., Schropp, R.E.I. Thin Solid Films, 383 (2001) p.125 – 128. Vavruňková, V., Müllerová, J., Šutta, P. AEEE. 6 (2007), p. 108-111.


