2013 Full-year results – Media Release
advertisement
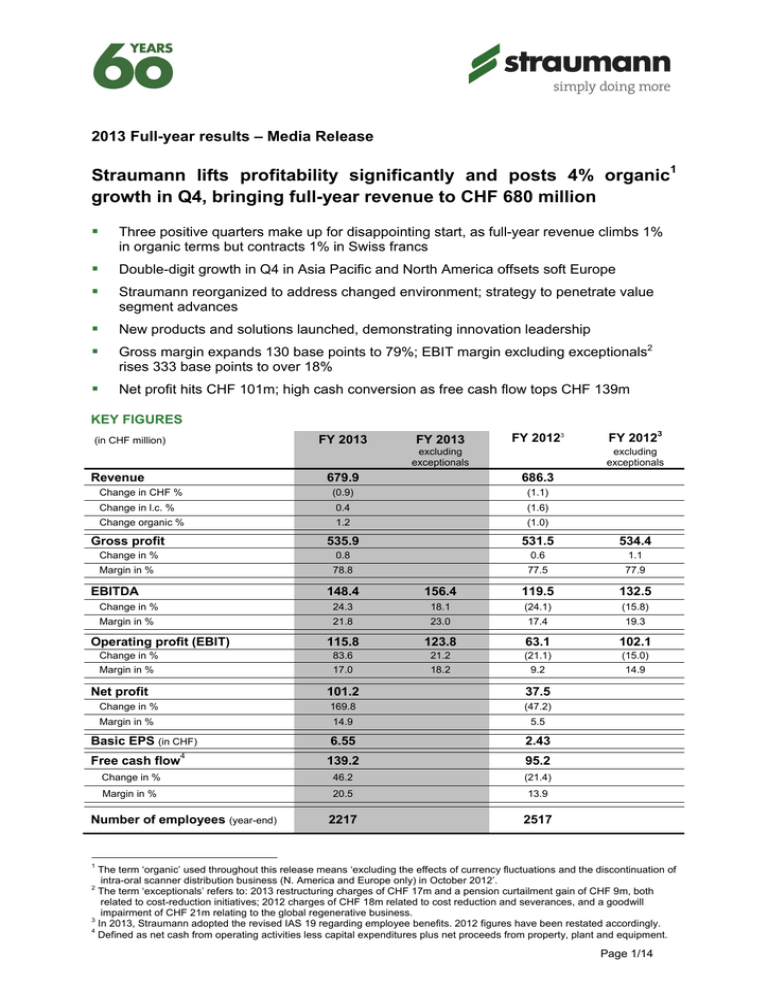
2013 Full-year results – Media Release Straumann lifts profitability significantly and posts 4% organic1 growth in Q4, bringing full-year revenue to CHF 680 million Three positive quarters make up for disappointing start, as full-year revenue climbs 1% in organic terms but contracts 1% in Swiss francs Double-digit growth in Q4 in Asia Pacific and North America offsets soft Europe Straumann reorganized to address changed environment; strategy to penetrate value segment advances New products and solutions launched, demonstrating innovation leadership Gross margin expands 130 base points to 79%; EBIT margin excluding exceptionals2 rises 333 base points to over 18% Net profit hits CHF 101m; high cash conversion as free cash flow tops CHF 139m KEY FIGURES FY 2013 (in CHF million) FY 2013 FY 20123 excluding exceptionals Revenue FY 20123 excluding exceptionals 679.9 686.3 (0.9) (1.1) Change in l.c. % 0.4 (1.6) Change organic % 1.2 (1.0) Gross profit 535.9 531.5 Change in % 0.8 0.6 1.1 Margin in % 78.8 77.5 77.9 Change in CHF % EBITDA 534.4 148.4 156.4 119.5 132.5 Change in % 24.3 18.1 (24.1) (15.8) Margin in % 21.8 23.0 17.4 19.3 Operating profit (EBIT) 115.8 123.8 63.1 102.1 Change in % 83.6 21.2 (21.1) (15.0) Margin in % 17.0 18.2 9.2 14.9 Net profit 101.2 37.5 Change in % 169.8 (47.2) Margin in % 14.9 5.5 6.55 2.43 Basic EPS (in CHF) Free cash flow 4 139.2 95.2 Change in % 46.2 (21.4) Margin in % 20.5 13.9 2217 2517 Number of employees (year-end) 1 The term ‘organic’ used throughout this release means ‘excluding the effects of currency fluctuations and the discontinuation of intra-oral scanner distribution business (N. America and Europe only) in October 2012’. 2 The term ‘exceptionals’ refers to: 2013 restructuring charges of CHF 17m and a pension curtailment gain of CHF 9m, both related to cost-reduction initiatives; 2012 charges of CHF 18m related to cost reduction and severances, and a goodwill impairment of CHF 21m relating to the global regenerative business. 3 In 2013, Straumann adopted the revised IAS 19 regarding employee benefits. 2012 figures have been restated accordingly. 4 Defined as net cash from operating activities less capital expenditures plus net proceeds from property, plant and equipment. Page 1/14 Basel, 25 February 2014: After a disappointing start to 2013, the Straumann Group achieved three consecutive quarters of solid organic growth to post full year net revenue of CHF 680 million, 1% above the prior year. The performance was driven by strong growth in North America, complemented by double-digit growth in China and a recovery in Japan in the second half. These collectively compensated for a continuing contraction in Europe. In the course of the year, Straumann reorganized to address the changed market environment and its cost base. Volume increases, further efficiency gains in production and resolute cost-reduction measures, including a 12% reduction in global headcount, enabled the Group to deliver its promise of a significant improvement in profitability. EBIT margin rose 330 base points to more than 18% excluding exceptionals, and net profit almost tripled to CHF 101 million. Free cash flow amounted to CHF 139 million, demonstrating Straumann’s high rate of cash conversion. Cash and cash equivalents at year-end amounted to CHF 384 million, and the equity ratio stood at 62%. The overall turn-around in performance was honored by a marked improvement in the stock price, contributing to a total shareholder return of 52% in 2013. CEO Marco Gadola commented: “In 2013, we had to adapt further to a market environment that is changing faster than anticipated. We had to follow through with radical measures to reduce costs, resize and reorganize. By focusing on savings that would not compromise quality, innovation, service and selling power, we still have one of the strongest teams of professionals in our industry and have succeeded in getting back to sustainable growth with significantly improved profitability – despite the persisting sluggishness in the dental markets. Cost-reductions have not weakened our drive to innovate – on the contrary, we have launched solutions that add efficiency and convenience. We have also developed products that reduce barriers to treatment and have the potential to change treatment paradigms. We have taken bold steps to compete on price and to penetrate the value segment through strategic entrepreneurial investments in a portfolio of separate brands. As a result, we have made a promising start to our 60th anniversary year.” BUSINESS PERFORMANCE Amid challenging market conditions, Straumann’s implant business expanded consistently as the year progressed to post solid overall growth driven by the Bone-Level range and an increased share of the high-performance material Roxolid®. The restorative business was mixed. Sales of implant prosthetics including CADCAM customized abutments grew solidly, but not enough to compensate for the shortfall in simple tooth-borne restoration elements, due to competition from in-lab and chairside milling. The contribution from digital equipment and software was expectedly smaller than in 2012, owing to the transfer of certain activities to Dental Wings and the discontinued distribution of intraoral scanners in October 2012. The Regeneratives business achieved modest growth, led by the periodontal tissue regeneration product Emdogain®. Page 2/14 REGIONS REVENUE BY REGION Q4 2013 Q4 2012 FY 2013 FY 2012 169.9 167.8 679.9 686.3 1.3 3.5 4.2 (4.4) (4.2) (3.3) (0.9) 0.4 1.2 (1.1) (1.6) (1.0) Europe 92.8 93.7 368.4 378.1 Change in CHF % Change in l.c. % Change organic % In % of Group revenue (0.9) (2.1) (1.4) (7.0) (6.3) (5.6) (2.6) (3.8) (3.2) 54.2 (6.5) (5.1) (4.3) 55.2 North America 46.0 43.3 181.7 173.7 Change in CHF % Change in l.c. % Change organic % In % of Group revenue 6.2 9.8 11.0 2.1 0.0 1.8 4.6 6.2 8.1 26.7 11.7 6.4 6.9 25.3 Asia / Pacific 25.0 24.4 98.4 103.9 Change in CHF % Change in l.c. % In % of Group revenue 2.4 16.3 (2.1) (1.0) (5.3) 4.7 14.5 3.2 (0.3) 15.1 (in CHF million) GROUP Change in CHF % Change in l.c. % Change organic % Rest of the World (ROW) 6.1 6.4 31.4 30.5 Change in CHF % Change in l.c.% In % of Group revenue (4.7) 1.8 (14.9) (10.4) 2.9 8.4 4.6 (7.3) (3.0) 4.4 Pockets of improvement in Europe The European market for high-end tooth replacement continued to suffer from the combined effects of poor consumer sentiment and higher healthcare costs and taxes, which reduced disposable income for dental treatments. Traffic at dental practices was slow, and patients delayed treatment or took cheaper conventional options. With the downward cycle persisting, the market has become increasingly competitive, especially in prosthetics. These developments squeezed Straumann’s revenue in the region by 3% in organic terms over the full-year and by 1% in Q4. In both cases, currencies contributed slightly more than 1 percentage point, bringing net revenue in the respective periods to CHF 368 million and CHF 93 million, corresponding to 54% of the Group. The strongest performances throughout the year were delivered by France and the UK. Demand was soft elsewhere. In Q4, Italy, Germany and the Benelux countries contracted. On the other hand, Spain and Sweden, which both suffered badly from the economic environment and structural changes in the market, reported considerable improvements, suggesting a return to growth. Later in the year, Straumann prepared a new strategic approach to Europe. It extended Roxolid with the new LOXIM™ transfer piece throughout its implant range, the main Page 3/14 advantage being that Roxolid reduces invasiveness by making it possible to use narrow and short implants that avoid bone augmentation. On 1 January 2014, the Group adjusted its implant pricing in initial European markets, offering Roxolid SLActive®/SLA® implants with LOXIM at the same price as the older titanium equivalents. At the same time, the price of the basic titanium SLA implant was reduced in parts of Europe to address the value segment more effectively. These initiatives are designed to increase market share and the first results are promising. Double-digit growth in North America in Q4 North America, Straumann’s second largest region, achieved good organic growth of 8% over the full-year. The weakening of the US dollar against the Swiss franc reduced growth in Swiss francs by one-and-a-half percentage points. Nevertheless, North American revenue reached a record level of CHF 182 million, corresponding to 27% of Group revenue – five percentage points higher than two years previously, endorsing Straumann’s strategy of continued investment in marketing and sales in the US. Here too, Roxolid and the bone-level implant range were the main drivers, in addition to Emdogain, while the restorative business posted solid growth. In Q4, organic growth reached 11% and revenue amounted to CHF 46 million. Growth was generated by all businesses but was most pronounced in implants and regeneratives. Asia/Pacific gains additional lift from pick-up in Japan On the back of successive quarterly increases, the Asia/Pacific region achieved full-year growth of 5% (l.c.), with revenues reaching CHF 98 million (15% of the Group). This was driven by the underpenetrated Chinese market and lifted by a recovery in the largest regional market, Japan, where Straumann regained market share. The considerable depreciation of the Japanese Yen stole 10 percentage points from growth resulting in a 5% contraction in Swiss francs. The region made further progress in the fourth quarter, achieving growth of 16% (l.c.), its highest quarterly increase in five years. All subsidiaries posted growth. The key growth drivers were Japan and China, which like distributor markets in South-East Asia posted exceptionally strong orders. Straumann is evaluating possibilities to adapt its business model in China to capture the full potential that this dynamic market offers. Having worked for several years to make its benefits of the SLActive surface available to customers and their patients in Japan, Straumann has received marketing approval from the Japanese health authority PMDA and has launched the product. Straumann is the first company to bring this implant surface technology to market in Japan, which will be a competitive advantage going forward. Strong growth in Latin America The region referred to as the ‘Rest of the World’ contributes approximately 5% of Group revenue, most of which is generated in Latin America and the Middle East. Full-year revenue increased 8% in local currencies but only 3% in Swiss francs to reach CHF 31 million. The currency impact was due to the strong depreciation of the Brazilian real. Brazil, which is now Page 4/14 the world’s largest implant market in volume terms, was the source of good growth both for Straumann and for Neodent. The region reported continued growth in Q4, but slower than in the preceding quarter, reflecting erratic distributor ordering patterns in the Middle East. OPERATIONAL AND STRATEGIC PROGRESS In the course of the year Straumann complemented its portfolio with a number of products, solutions and brands, most of which were added/launched in the fourth quarter. Reducing invasiveness with Roxolid The Group extended the option of Roxolid to its entire range of implants and launched a new 4mm short implant. Designed to reduce invasiveness and to make treatment possible for patients with insufficient bone by helping avoid bone augmentation procedures, Roxolid implants have the potential to save time, money and trauma, thus increasing patient acceptance. All Straumann’s Roxolid implants are supplied with the new LOXIM™ transfer piece for convenient handling. New ceramic implant – an innovative alternative Straumann’s ceramic monotype implant entered a controlled market release prior to a broader scale launch later in 2014. Featuring the new ZLA™ surface for enhanced osseointegration, it provides an excellent reliable alternative for patients who ask for metalfree implants. Broader prosthetic possibilities with guaranteed precision and reliability A significant addition to Straumann’s prosthetic range in 2013 was the CARES® Variobase™ abutment, which offers labs a precise, reliable solution for producing their own abutments with an original Straumann connection. This is the key to a collaboration initiated in Q4 that enables 3Shape users to produce customized restorations with an original Straumann connection. Joint efforts to drive CADCAM solutions The Group continued to develop its CARES Visual software, adding innovative features and functionalities to streamline workflows. The integration of its CADCAM system with the Dental Wings Open Software platform was completed, offering customers an open system with a range of possibilities for data input and milling. As a result of these developments, the Group agreed with its partner Dental Wings to combine, and thus strengthen, their respective rival scanner businesses creating critical mass and synergies. Straumann’s scanner production unit is therefore transferring to Dental Wings. Penetrating the ‘value’ segment The Group took further steps to penetrate the value segment in Q4. It launched Neodent in Spain and took steps towards establishing the brand in the US. Straumann also acquired 51% of Medentika in Germany, a rapidly-expanding provider of cost-effective implants and Page 5/14 prosthetics for multiple implant systems, and 30% of Createch Medical in Spain, a specialist in high-end CADCAM prosthetics for multiple implant systems. OPERATIONS AND FINANCES Gross margin edges up to 79% The cost of goods sold increased slower than revenue thanks to efficiency gains, higher volumes, insourcing and a more favorable business mix (fewer lower-margin scanner sales). With gross profit amounting to CHF 536 million, the respective margin rose 130 base points to almost 79%. Excluding exceptionals, the expansion was 90 base points. Cost-reduction and reorganization measures, together with general fluctuation, reduced the Group’s global workforce by 300 to 2217 at year-end. These measures resulted in full-year restructuring charges of CHF 17 million, the majority of which were related to severance compensation. At the same time, the workforce reduction resulted in a pension curtailment gain of CHF 9 million, bringing the net effect to CHF 8 million. Operating profit margin expands more than 300 base points Thanks to the cost-reduction measures and tighter cost control, total operating expenses were successfully reduced by CHF 19 million in 2013 (excluding exceptionals). In line with the accounting standard IAS 1, the Group is now disclosing its operating expenses as ’distribution costs’ and ‘administrative expenses’ in the Income Statement. The former comprises salesforce and other directly related sales activities, while the latter comprises marketing activities, research & development, and general administration. On a reported basis, distribution costs increased to CHF 169 million or 25% of sales. Administrative expenses decreased to CHF 254 million or 37% of sales. Despite cost reductions, Straumann’s drive to innovate remains undiminished, and the Group aims to maintain its historic level of R&D investment at around 6-7% of sales. Due to the abovementioned items, earnings before interest, tax, depreciation, amortization (EBITDA) and exceptionals rose by CHF 24 million to CHF 156 million. The corresponding margin thus expanded 370 base points to 23%. After ordinary amortization and depreciation charges of approximately CHF 33 million, operating profit (EBIT) excluding exceptionals amounted to CHF 124 million, compared with CHF 102 million in the prior year. With the respective margin reaching 18%, profitability improved 333 base points – or 380 base points at constant exchange rates. Net profit benefits from Neodent contribution The full-year net financial result was a negative CHF 2 million, compared with the flat result in 2012. This was due mainly to interest expenses related to the CHF-200-million bond launched at the end of April with a seven-year duration and a coupon of 1.625%. Page 6/14 The contributions from Neodent, Dental Wings, Medentika and Createch (disclosed under ‘share of result of associates’) amounted to CHF 6 million, including the combined effects of purchase price allocation. Income taxes came to CHF 19 million or 16% of pre-tax profit. Taking the abovementioned factors into account, reported net profit amounted to CHF 101 million, with the corresponding margin reaching 15%. Basic earnings per share amounted to CHF 6.55. Strong operating cash flow Net cash from operating activities increased 22% to CHF 152 million, mainly owing to improved profitability and lower tax payments in the period, while the ‘change in net working capital’ was only slightly negative. With capital expenditure (CAPEX) down CHF 7 million at CHF 13 million, free cash flow amounted to CHF 139 million and the respective margin was 21% (free-cash-flow yield of 6.2%). The purchase consideration for the 51% stake in Medentika and 30% stake in Createch amounted to CHF 38 million, adding to the cash used in investing activities of CHF 63 million. Net cash from financing activities totaled CHF 156 million, after considering the bond proceeds of CHF 199 million and the payment of CHF 58 million for the 2012 dividend. Consequently, cash and cash equivalents at the end of 2013 amounted to CHF 384 million, up from CHF 141 million in 2012. The equity ratio amounted to 62% at the end of 2013. Unchanged dividend The Board of Directors will propose an ordinary dividend of CHF 3.75 per share to the Shareholders at the Annual General Meeting on 11 April 2014 (ex-dividend date 15 April). Furthermore, Straumann disclosed today that Mr Dominik Ellenrieder will step down from the Board at the Annual General Meeting having served Straumann as a Director since 2001. OUTLOOK 2014 (barring unforeseen circumstances) Straumann expects the global implant market to develop positively in 2014 and its revenue to grow in the low-single-digit range (l.c.). The Group will continue to invest in dental growth markets and will extend the reach of its non-premium offering. Despite this, and thanks to the full-impact of the cost-reduction measures, Straumann aims to expand operating income margin in 2014 and to achieve solid growth with further operating margin improvement in the mid-term. Annual Report 2013 The pre-print version of Straumann’s 2013 Annual Report is now available – in English only – at annualreport.straumann.com as well as through the Media and Investors pages at www.straumann.com. Page 7/14 About Straumann Headquartered in Basel, Switzerland, Straumann (SIX: STMN) is a global leader in implant, restorative and regenerative dentistry. In collaboration with leading clinics, research institutes and universities, Straumann researches, develops and manufactures dental implants, instruments, prosthetics and tissue regeneration products for use in tooth replacement and restoration solutions or to prevent tooth loss. Straumann currently employs approximately 2200 people worldwide and its products and services are available in more than 70 countries through its broad network of distribution subsidiaries and partners. Straumann Holding AG, Peter Merian-Weg 12, 4002 Basel, Switzerland. Phone: +41 (0)61 965 11 11 / Fax: +41 (0)61 965 11 01 E-mail: investor.relations@straumann.com or corporate.communication@straumann.com Homepage: www.straumann.com Contacts: Corporate Communication: Mark Hill +41 (0)61 965 13 21 Thomas Konrad +41 (0)61 965 15 46 Investor Relations: Fabian Hildbrand +41 (0)61 965 13 27 Disclaimer This release contains certain forward-looking statements that reflect the current views of management. Such statements are subject to known and unknown risks, uncertainties and other factors that may cause actual results, performance or achievements of the Straumann Group to differ materially from those expressed or implied in this release. Straumann is providing the information in this release as of this date and does not undertake any obligation to update any statements contained in it as a result of new information, future events or otherwise. Media and analysts’ conference Straumann’s full-year 2013 financial results conference will take place at 10:30h CET in Basel today. The event will be webcast live on the internet (www.straumann.com/webcast) and can also be accessed by telephone at the following dial-in numbers: +41 (0)58 310 50 09 (Europe & RoW) +44 (0)203 059 58 62 (UK) +1 (1)631 570 5613 (USA) The recorded webcast will be available for the next month. Presentation slides The corresponding conference visuals are available at www.straumann.com/Straumann-2013-FY-Presentation.pdf and on the Media and Investors pages at www.straumann.com. Page 8/14 Upcoming corporate/investor events 27 February 2014 28 February 2014 05 March 2014 06 March 2014 07 March 2014 17 March 2014 02 April 2014 11 April 2014 15 April 2014 22 April 2014 30 April 2014 Investor meetings, Frankfurt Investor meetings, Paris Investor meetings, New York Investor meetings, New York and Baltimore Investor meetings, Chicago Investor meetings, Geneva Kepler Cheuvreux Swiss equities conference, Zurich 2014 Annual General Meeting (Congress Center, Basel) Dividend ex-date Dividend payment date First quarter results (webcast/conference call) Details on upcoming investor relations activities are published on www.straumann.com (Investors > Events). Straumann Media Releases subscription: www.straumann.com/en/home/investor-relations/ir-contacts-and-services/subscription.html RSS feed subscription: www.straumann.com/en/home/media/media-releases.news.rss Page 9/14 Consolidated statement of financial position Assets (in CHF 1 000) Property, plant and equipment Investment properties Intangible assets Investments in associates 31 Dec 2013 31 Dec 2012 Restated 1 Jan 2012 Restated 83 907 97 362 110 588 4 335 6 680 7 500 72 278 75 595 100 740 6 624 255 115 249 239 Financial assets 14 639 354 857 Other receivables 1 258 2 216 2 351 Deferred income tax assets 26 392 28 701 30 685 Total non-current assets 457 924 460 147 259 345 Inventories 62 328 63 636 67 010 111 390 104 447 109 898 Financial assets 1 918 6 240 982 Income tax receivables 2 385 1 900 1 069 Cash and cash equivalents 383 795 140 504 377 053 Total current assets 561 816 316 727 556 012 1019 740 776 874 815 357 31 Dec 2013 31 Dec 2012 Restated 1 Jan 2012 Restated Trade and other receivables Total assets Equity and liabilities (in CHF 1 000) Share capital 1 568 1 568 1 568 Retained earnings and reserves 629 812 600 089 641 253 Total equity attributable to the shareholders of the parent company 631 380 601 657 642 821 Straight bond 199 301 0 0 Other liabilities 6 094 6 725 6 703 Financial liabilities 3 667 34 64 Provisions 32 221 13 467 8 817 Retirement benefit obligations 18 482 37 089 33 713 Deferred income tax liabilities 9 788 10 888 12 343 Total non-current liabilities 269 553 68 203 61 640 Trade and other payables 103 613 93 964 89 655 Financial liabilities Income tax payable Provisions 24 25 1 758 9 100 10 423 18 449 6 070 2 602 1 034 Total current liabilities 118 807 107 014 110 896 Total liabilities 388 360 175 217 172 536 1019 740 776 874 815 357 Total equity and liabilities The financial statements above are an extract of the audited statements published in Straumann’s 2013 Financial Report. Page 10/14 Consolidated income statement (in CHF 1 000) Revenue Cost of goods sold Gross profit Other income 2013 2012 Restated 679 922 686 253 (144 007) (154 733) 535 915 531 520 2 747 1 763 Distribution costs (168 507) (156 372) Administrative expenses (254 372) (313 858) 115 783 63 053 Finance income 22 175 16 693 Finance expense (23 909) (16 818) 5 841 (5 743) Operating profit Share of result of associates Profit before income tax 119 890 57 185 Income tax expense (18 689) (19 680) Net profit 101 201 37 505 101 201 37 505 Attributable to: Shareholders of the parent company Basic earnings per share (in CHF) 6.55 2.43 Diluted earnings per share (in CHF) 6.50 2.43 Page 11/14 Consolidated statement of comprehensive income (in CHF 1 000) Net profit 2013 101 201 2012 Restated 37 505 Other comprehensive income to be reclassified to profit or loss in subsequent periods: Net foreign exchange loss on net investment loans Income tax effect Net movement on cash flow hedges Income tax effect (2 858) 208 (2 284) 296 (3 559) 286 2 281 ( 296) Exchange differences on translation of foreign operations (32 445) (14 894) Other comprehensive income to be reclassified to profit or loss in subsequent periods: (37 083) (16 182) (2 903) 10 010 (1 302) 0 (2 707) 401 5 805 (2 306) Other comprehensive income, net of tax (31 278) (18 488) Total comprehensive income, net of tax 69 923 19 017 69 923 19 017 Items not to be reclassified to profit or loss in subsequent periods: Change in fair value of financial assets designated through other comprehensive income Remeasurements of retirement benefit obligations Income tax effect Items not to be reclassified to profit or loss in subsequent periods: Attributable to: Shareholders of the parent company Page 12/14 Consolidated cash flow statement (in CHF 1 000) Net profit 2013 2012 Restated 101 201 37 505 Adjustments for: Taxes charged 18 689 19 680 Interest and other financial result 3 695 927 Foreign exchange result 6 144 5 534 Fair value adjustments 1 940 (3 668) (5 841) 5 743 24 392 27 104 558 300 6 807 7 488 Share of result of associates Depreciation and amortization of: Property, plant and equipment Investment properties Intangible assets Impairment of investment properties Impairment of intangible assets 1 787 520 0 21 000 Impairment reversal of property, plant and equipment ( 883) Change in provisions, retirement benefit obligations and other liabilities 9 912 1 363 Share-based payments expense 3 336 3 348 Loss/(gain) on disposal of property, plant and equipment 0 ( 90) 113 ( 518) 2 207 (4 835) 3 350 4 292 5 292 (1 519) ( 728) Working capital adjustments: Change in inventories Change in trade and other receivables Change in trade and other payables Interest paid Interest received 325 651 Income tax paid (17 902) (23 169) Net cash from operating activities 151 490 114 560 Purchase of financial assets (16 154) Purchase of property, plant and equipment (10 907) (15 051) (1 743) (4 375) (37 985) (265 973) Purchase of intangible assets Purchase of investments in associates Contingent consideration paid Disbursement of loans Dividends received from associates Net proceeds from sale of non-current assets 0 0 ( 740) (1 200) 0 5 009 503 393 Net cash used in investing activities (62 587) Issue of a straight bond 199 230 Dividends paid (57 848) 88 (285 548) 0 (58 033) Proceeds from finance lease 292 732 Repayment of finance lease ( 42) ( 244) Transaction costs paid 0 ( 995) Purchase of treasury shares (1 886) (6 637) Sale of treasury shares 15 907 1 687 155 653 (63 490) Net cash received from/(used in) financing activities Exchange rate differences on cash held (1 265) (2 071) Net change in cash and cash equivalents 243 291 Cash and cash equivalents at 1 January 140 504 (236 549) 377 053 Cash and cash equivalents at 31 December 383 795 140 504 Page 13/14 Consolidated statement of changes in equity 2013 Attributable to the shareholders of the parent company (in CHF 1 000) As at 1 January 2013 Share capital Share premium Treasury shares 1 568 18 280 (33 975) Cash flow hedge reserve 1 988 Translation reserves (88 774) Profit for the period Other comprehensive income Total comprehensive income 0 0 0 702 570 601 657 101 201 101 201 (35 095) 5 805 (1 988) (35 095) 107 006 69 923 (57 848) (57 848) Share-based payment transactions 3 336 Purchase of treasury shares (1 886) Sale of treasury shares 18 280 (20 725) (31 278) 3 336 (1 886) 15 136 1 568 Total equity (1 988) Dividends paid As at 31 December 2013 Retained earnings 0 (123 869) 1 062 16 198 756 126 631 380 2012 Attributable to the shareholders of the parent company (in CHF 1 000) Share capital As at 1 January 2012 1 568 Share premium Treasury shares 42 267 (30 261) Cash flow hedge reserve 3 Changes in accounting policies As at 1 January 2012 (Restated) Translation reserves (70 532) ( 75) 1 568 42 267 (30 261) Total comprehensive income 0 0 0 642 821 37 505 37 505 (18 167) (2 306) (18 488) 1 985 (18 167) 35 199 19 017 Share-based payment transactions ( 995) ( 995) (34 046) (58 033) 3 348 (6 637) Sale of treasury shares As at 31 December 2012 (28 297) 699 851 1 985 (23 987) Purchase of treasury shares 18 280 (33 975) 3 348 (6 637) 2 923 1 568 671 118 (28 222) (70 607) Transactions with equity owners Dividends paid 728 073 Total equity 3 Profit for the period Other comprehensive income Retained earnings ( 787) 1 988 (88 774) 702 570 2 136 601 657 # # # Page 14/14
