Premium Traffic Analysis
advertisement

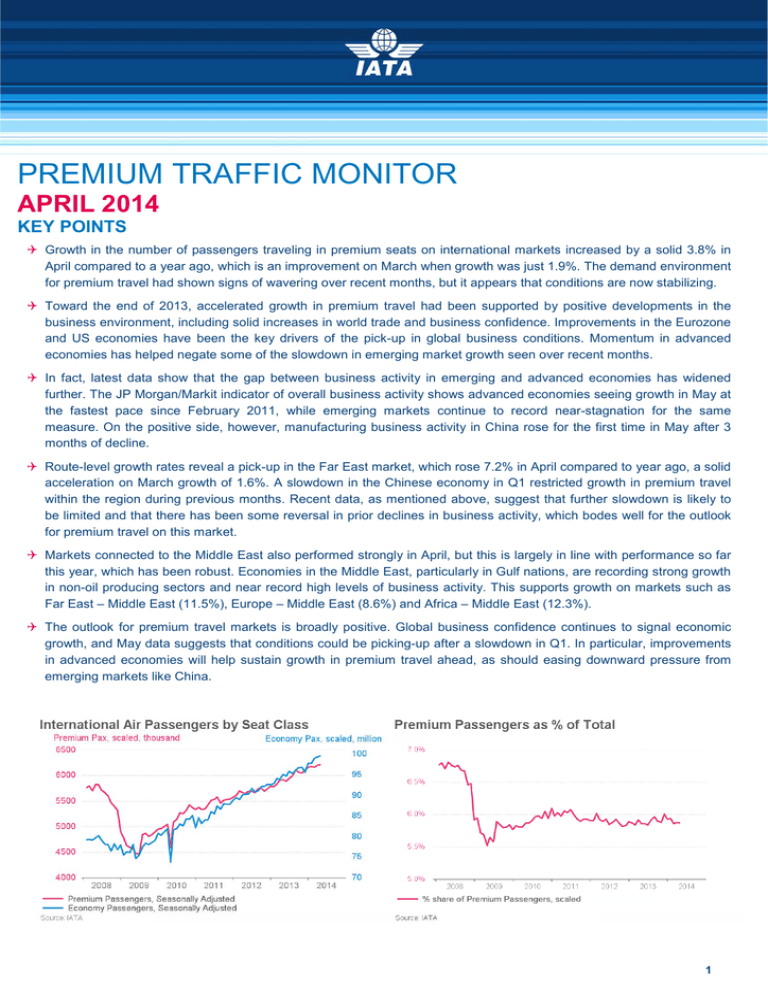
PREMIUM TRAFFIC MONITOR APRIL 2014 KEY POINTS Growth in the number of passengers traveling in premium seats on international markets increased by a solid 3.8% in April compared to a year ago, which is an improvement on March when growth was just 1.9%. The demand environment for premium travel had shown signs of wavering over recent months, but it appears that conditions are now stabilizing. Toward the end of 2013, accelerated growth in premium travel had been supported by positive developments in the business environment, including solid increases in world trade and business confidence. Improvements in the Eurozone and US economies have been the key drivers of the pick-up in global business conditions. Momentum in advanced economies has helped negate some of the slowdown in emerging market growth seen over recent months. In fact, latest data show that the gap between business activity in emerging and advanced economies has widened further. The JP Morgan/Markit indicator of overall business activity shows advanced economies seeing growth in May at the fastest pace since February 2011, while emerging markets continue to record near-stagnation for the same measure. On the positive side, however, manufacturing business activity in China rose for the first time in May after 3 months of decline. Route-level growth rates reveal a pick-up in the Far East market, which rose 7.2% in April compared to year ago, a solid acceleration on March growth of 1.6%. A slowdown in the Chinese economy in Q1 restricted growth in premium travel within the region during previous months. Recent data, as mentioned above, suggest that further slowdown is likely to be limited and that there has been some reversal in prior declines in business activity, which bodes well for the outlook for premium travel on this market. Markets connected to the Middle East also performed strongly in April, but this is largely in line with performance so far this year, which has been robust. Economies in the Middle East, particularly in Gulf nations, are recording strong growth in non-oil producing sectors and near record high levels of business activity. This supports growth on markets such as Far East – Middle East (11.5%), Europe – Middle East (8.6%) and Africa – Middle East (12.3%). The outlook for premium travel markets is broadly positive. Global business confidence continues to signal economic growth, and May data suggests that conditions could be picking-up after a slowdown in Q1. In particular, improvements in advanced economies will help sustain growth in premium travel ahead, as should easing downward pressure from emerging markets like China. 1 Premium Traffic Monitor April 2014 Growth in international trade is a good indicator of business travel. This is not only because of the obvious link to the manufacturing sector, but also because international trade is a good proxy for the drivers of business travel in other key sectors, such as finance and consulting. During recent months, there has been some improvement in international trade growth, supporting stronger growth in businessrelated premium travel over recent months. But beyond this cyclical improvement in the global economy and world trade growth, recent developments suggest that increases in protectionist measures could be resulting in a similar pace of trade expansion as domestic industrial production. Previously, trade expanded at twice the pace of domestic growth. If this past relationship is not restored, rates of expansion in trade could be limited, as could growth in business-related air travel. The second chart below shows business confidence (measured here by the JP Morgan/Markit purchasing managers’ index), indicating a pick-up in growth in business activity since mid-2013. The acceleration in global business conditions over the past several quarters reflects better performance of advanced economies. During Q1 2014, however, the improvement in business conditions has slowed slightly, mostly due to negative developments in emerging economies. Most recent data show a slight improvement in manufacturing activity in May, which is a positive sign and suggests that the slowdown in the Chinese economy is limited. Financial market sentiment can also provide an indication of the state of the global economy, and demand for business related travel. The third chart below shows the MSCI World share price index and its movement relative to premium travel growth. The share price index tends to lead changes in premium travel demand by several months, as fluctuations in companies’ financial performance take time to affect business travel plans. Current financial market performance, as indicated by the MSCI World share price index, shows weakness in share values in 2014. Much of the decline is due to the emerging market weakness, but the latest data (May) show some reversal in the declining trend of prior months. 2 Premium Traffic Monitor April 2014 TRAFFIC GROWTH BY MAJOR ROUTE Route-level growth rates reveal a pick-up in the Far East market, which rose 7.2% in April compared to year ago, a solid acceleration on March growth of 1.6%. The Chinese economy slowed to 7.4% growth in Q1 2014, which restricted expansion in premium travel in the region during previous months. Recent data, however, show that further slowdown is likely to be limited and that there has been some reversal in prior declines in business activity. More specifically, according to JP Morgan/Markit, the measure of manufacturing activity rebounded in May, with activity being supported by a strong rise in export order growth. This bodes well for regional trade and related business travel. Markets connected to the Middle East also performed strongly in April, but this is largely in line with performance so far this year, which has been robust. Economies in the Middle East, particularly in Gulf nations, are recording strong growth in non-oil producing sectors and near record high levels of business activity. This supports growth on markets such as Far East – Middle East (11.5%), Europe – Middle East (8.6%) and Africa – Middle East (12.3%). The within Europe premium travel market was up 2.6% in April compared to a year ago, a rebound from the 2.5% contraction in March. Economic activity in the region has been showing slow and steady improvement, and recent data suggest that strong increases in industrial production should result in acceleration in Eurozone GDP in Q2. This should also provide an improved demand backdrop for air travel in the region. Improving economic conditions in the US combined with strong growth of markets in Central America continue to support healthy expansion rates for premium travel between these regions. Mexico’s economy has been improving over the past several months, reflecting government spending efforts and stronger exports demand. Premium air travel on the North America – Central America market increased 11.3% in April year-on-year. IATA Economics th 19 June 2014 E-Mail: economics@iata.org 3 Premium Traffic Monitor April 2014 TRAFFIC GROWTH BY ROUTE – APRIL 2014 Premium Traffic Growth Economy Traffic Growth Apr 14 vs. Apr 13 Apr 14 vs. Apr 13 YTD 2014 vs. YTD 2013 YTD 2014 vs. YTD 2013 Total Traffic Growth Apr 14 vs. Apr 13 YTD 2014 vs. YTD 2013 Africa - Far East -3.4% -8.0% 6.9% -2.2% 5.9% -2.7% Africa - Middle East 12.3% 12.0% 11.2% 11.0% 11.3% 11.1% Europe - Africa -3.4% -2.1% 4.3% -1.1% 3.4% -1.2% Europe - Far East 0.3% 4.2% 9.8% 6.6% 8.6% 6.3% Europe - Middle East 8.6% 8.1% 13.6% 10.3% 13.0% 10.1% Far East - Southwest Pacific 12.6% 10.6% 13.9% 4.4% 13.8% 5.0% Mid Atlantic 13.8% 5.8% 8.0% -1.7% 8.6% -0.8% Middle East - Far East 11.5% 10.9% 16.8% 10.9% 16.3% 10.9% North America - Central America 11.3% 8.3% 13.6% 9.1% 13.4% 9.0% North America - South America 3.6% 5.8% 5.2% 0.7% 5.0% 1.3% North and Mid Pacific 4.6% 4.9% 7.2% 6.4% 6.8% 6.2% North Atlantic -0.1% 2.5% 7.1% 4.3% 6.0% 4.0% Other routes 6.0% 6.9% 8.7% 6.9% 8.4% 6.9% South Atlantic -3.1% -0.5% 4.7% -0.2% 3.8% -0.2% South Pacific 0.1% 7.6% 2.2% 4.9% 1.9% 5.2% Within Africa -8.3% -6.0% -0.6% -2.2% -1.4% -2.6% Within Europe 2.6% 0.9% 7.4% 4.7% 7.1% 4.5% Within Far East 7.2% 6.2% 6.4% 3.8% 6.5% 3.9% Within North America -0.6% 3.5% 9.2% 8.6% 8.0% 8.0% Within South America -8.1% -5.7% -3.6% -4.8% -3.9% -4.8% Total 3.8% 4.2% 8.0% 4.9% 7.6% 4.9% PREMIUM TRAFFIC GROWTH BY ROUTE – PREVIOUS MONTH Share of Premium Share of Total Traffic Revenues Traffic Revenue Africa - Far East 0.7% 0.9% 8.4% 26.8% Africa - Middle East 1.9% 1.0% 7.0% 24.8% Europe - Africa 4.5% 7.7% 15.8% 60.9% Europe - Far East 10.0% 14.5% 11.3% 41.2% Europe - Middle East 4.6% 5.3% 11.0% 45.2% Far East - Southwest Pacific 3.2% 3.2% 9.3% 29.7% Mid Atlantic 1.6% 1.7% 7.0% 28.9% Middle East - Far East 3.1% 2.2% 4.7% 18.2% North America - Central America 4.5% 1.5% 3.7% 8.6% North America - South America 2.9% 3.2% 11.0% 30.6% North and Mid Pacific 5.6% 11.2% 12.3% 38.1% North Atlantic 13.5% 22.8% 16.1% 55.4% Other routes 6.8% 5.0% 8.4% 27.5% South Atlantic 2.2% 3.4% 11.8% 36.2% South Pacific 1.0% 2.5% 16.6% 48.1% Within Africa 1.8% 0.7% 7.3% 20.8% Within Europe 12.5% 4.1% 2.3% 10.4% Within Far East 17.9% 8.0% 5.7% 16.1% Within North America 0.9% 0.5% 2.2% 7.5% Within South America 0.9% 0.4% 5.3% 10.6% Total 100.0% 100.0% 5.9% 29.4% 4 Premium Traffic Monitor April 2014 5


