Scenario Planning Tools & Practice
advertisement

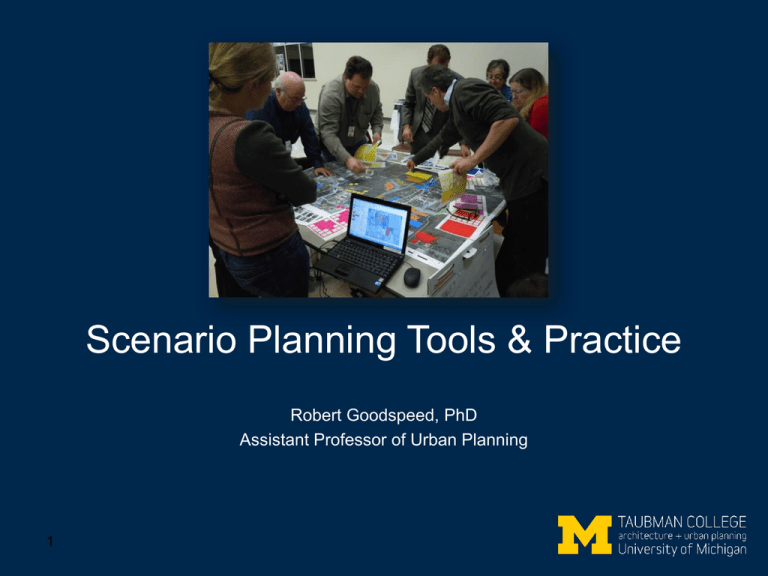
Scenario Planning Tools & Practice Robert Goodspeed, PhD Assistant Professor of Urban Planning 1 Outline Scenario Planning Introduction Scenario Planning Tools & Practice Austin Sustainable Places Project 2 Scenario Planning Introduction 3 Types of Planning Forecasting Visioning Scenario Planning Challenges • - 4 How realistic is the vision? Can it be implemented (externally and internally)? If you build it, will it work as you expect? • • Forecasts are very often wrong Lack a plan of action if surprises happen • • How to pick the “right” forces? How to engage multiple stakeholders? Limits to Forecasting Metro Detroit Average Daily VMT, Actual and Forecast 170 160 150 Estimated 2013 140 Actual 130 2040 LRP (2013) 2035 LRP (2008) 120 2030 LRP (2004) 2025 LRP 110 2020 LRP 2015 LRP 100 90 80 1980 5 1990 2000 2010 2020 2030 Note: VMT estimation methodology varies between studies. Data Sources: SEMCOG, Suburbs Alliance. 2040 2050 Limits to Expertise “Heavier-than-air flying machines are impossible.” – Lord Kelvin “With over fifty foreign cars already on sale here, the Japanese auto industry isn’t likely to carve out a big slice of the U.S. market for itself.” – Business Week, 1968 “I think there is a world market for about five computers” – Thomas Watson, IBM Chairman, 1943 The Experts Speak, quoted in Schoemaker 1991 6 Scenario Planning • Combines art (creativity) and science (rigorous analysis) • Suited for contexts with high uncertainty and many non-quantifiable factors • Possible benefits: (Huss 1988) – – – – 7 Long range perspective Learning and consensus Identifies novel ideas Encourages contingency planning Scenario Planning Overview Identify Key Internal & External Driving Forces Construct Multiple Scenarios That Represent Potential “Alternative Futures” Analyze Scenarios See Federal Highway Administration (2011) 8 Select “Preferred” Scenario for Implementation Monitoring & Adjustment Scenario Planning Contexts & Scales • • • • Nations (e.g., South Africa see Kahane 2012) Companies (e.g., Royal Dutch Shell, many others see Phelps et al 2001) Military (e.g. RAND studies of nuclear war) U.S. Cities and Regions – 80 integrated land use-transportation scenario planning projects (Bartholomew 2007) 9 U.S. Land Use-transportation Scenario Planning Projects Source: Bartholomew 2007 10 Michigan Projects: SEMCOG, "Fiscal Impacts of Alternative Land Development Patterns in Michigan" (1996), Tri-County Regional Planning Commission (Lansing, MI), Regional Growth: Choices for Our Future/Regional 2025 Transportation Plan, 2003. Source: Bartholomew 2007. Who are the stakeholders for land usetransportation scenarios? • Municipalities • Metropolitan Planning Organization • State Agencies • Anchor Institutions • Major Employers • Developers • Advocates • Others? Collaborative Planning (NOT consensus) Why? Stakeholder input needed for a good plan, cooperation needed for implementation 11 Scenario Planning Tools & Practice Austin Sustainable Places Project 12 Austin Image: Tour Texas Fig. 4.9 13 Austin “Growing a Quality Community” “Gateway to the hill country” “BBQ Capital of Texas” “Perfectly Situated” See Fig. 4.11, 4.13, 4.14, 4.16 14 Planning Process and Time Line 1 Summer 2012 Existing Conditions and Visioning Vision Workshop October 11, 2012 2 3 4 Fall 2012/ Winter 2013 Spring/ Summer 2013 Fall 2013 Plan Development and Scenarios Draft Plan Final Plan Documentation Planning Charrette January 31, 2013 Public Meetings Present to City Council Open House February 28, 2013 Source: Austin Sustainable Places Project. Lockhart Community Design Workshop: Scenario Planning Charrette. Presented at Lockhart Demonstration Site, January 31, 2013. City Council Review and Adoption Constructing a Scenario Attendees: • Property Owners • Elected Officials • Neighborhood Organizations • Business Owners • Etc Austin Sustainable Places Project, Lockhart, TX Source: Goodspeed (2013) 16 Development Type Chip Menu Source: Austin Sustainable Places Project. Lockhart Community Design Workshop: Scenario Planning Charrette. Presented at Hutto Demonstration Site, November 8, 2012. • Compact and walkable • Streetfront retail • Residential, office and service uses • Community gathering places • Mostly 2 - 3 floors • One chip = 1 acre • Jobs per chip = 32 • Households per chip = 24 Source: Austin Sustainable Places Project. Lockhart Community Design Workshop: Scenario Planning Charrette. Presented at Hutto Demonstration Site, November 8, 2012. Real-Time Scenario Planning Indicators 1. Developed Acres 2. Rate of Redevelopment/Infill 3. Housing by Type 4. Housing Mix 5. Population 6. Employment by Type 7. Employment Mix 8. Jobs-Housing Balance 9. Housing Units per Net Acre 10. Jobs per Net Acre 11. Property Tax Revenue 12. Sales Tax Revenue 13. Fiscal Impact Housing by Type 2,500 606 2,000 1,500 153 72 334 1,000 500 - 48 2-481 1,621 171 30 15 96 297 996 Charrette Scenario Regional Growth Scenario Trend Scenario Sales Tax Revenue $2,000,000 $1,800,000 $1,600,000 $1,400,000 $1,200,000 $1,000,000 $800,000 $600,000 $400,000 $200,000 $0 $1,749,317 $702,015 Charette Scenario Source: Austin Sustainable Places Project. Lockhart Community Design Workshop: Scenario Planning Charrette. Presented at Hutto Demonstration Site, November 8, 2012. $454,414 Regional Growth Scenario Trend Scenario From multiple Scenario maps… Compilation Scenario A Compilation Scenario B Source: Austin Sustainable Places Project. Lockhart Community Design Workshop: Scenario Planning Charrette. Presented at Lockhart Demonstration Site, January 31, 2013. Distill Findings Into Strategic Choices Scenarios Analyses Preferred Plan & Implementation Program Source: Austin Sustainable Places Project. Lockhart Community Design Workshop: Scenario Planning Charrette. Presented at Lockhart Demonstration Site, January 31, 2013. I-PLACE3S User Guide Chapter 8 Figure 108 Scenario Planning Tools INDEX PlanBuilder Select Mark Place Type from the command menu and then select the Place Type you'd like to mark (Figure 109). Clicking on a polygon will mark all parcels that are contained within the polygon with the Place Type you have selected. Figure 109 Getting Started Guide Indicator maps are also accessed through the Indicator Results table by clicking the map icon in the right-side column. Page 90 Envision Tomorrow Where? Illustrative Indicators Across the U.S. • • • • • INDEX 505/200 59 Revised: 4/29/08 Urban Footprint PLACE3S California Metros Metro Sacramento June 2010 30 states and 6 countries Estimated Vehicle Miles Traveled / Greenhouse Gas Emissions Impervious Surface Housing Diversity / Affordability Energy Use Air Quality For tool summary see Holway et al (2012) 22 Tools: Scale & Types of Scenarios 23 Image Source: Avin, Uri. "Best Scenarios for Apps Best Apps for Scenarios" Florida APA Conference, 11 September 2013. Conclusion • Good plans: – smart (good data, analysis & recognize uncertainty) – lead to implementation (broad support) • Scenario planning and planning support systems are set of methods and tools used to do this • New tools mean you can do this in your community! 24 Thank You! Robert Goodspeed Assistant Professor of Urban Planning University of Michigan rgoodspe@umich.edu Twitter: @rgoodspeed Scenario Planning Tool Research: Goodspeed, Robert. Planning Support Systems for Spatial Planning Through Social Learning. PhD Dissertation. MIT Department of Urban Studies and Planning. Available online at: http://dspace.mit.edu/handle/1721.1/81739 25 Works Cited Bartholomew, K. 2007. Land use-transportation scenario planning: promise and reality. Transportation 34 (4):397-412. Federal Highway Administration. 2011. FHWA Scenario Planning Guidebook. Available online at http://www.fhwa.dot.gov/planning/scenario_and_visualization/scenario_planning/scenario _planning_guidebook/ Holway, Jim, C.J. Gabbe, Frank Hebbert, Jason Lally, Robert Matthews, and Ray Quay. 2012. Opening Access to Scenario Planning Tools. In Policy Focus Report. Cambridge, Mass.: Lincoln Institute of Land Policy. Huss, WR. 1988. A move toward scenario analysis. International Journal of Forecasting 4 (3):377-388. Kahane, Adam. 2012. Transformative scenario planning : working together to change the future. 1st ed. San Francisco: Berrett-Koehler Publishers. Phelps, R, C Chan, and SC Kapsalis. 2001. Does scenario planning affect performance? Two exploratory studies. Journal of Business Research 51 (3):223-232. Schoemaker, PJH. 1991. When and how to use scenario planning: a heuristic approach with illustration. Journal of forecasting 10 (6):549-564. 26


