click here for presentation
advertisement
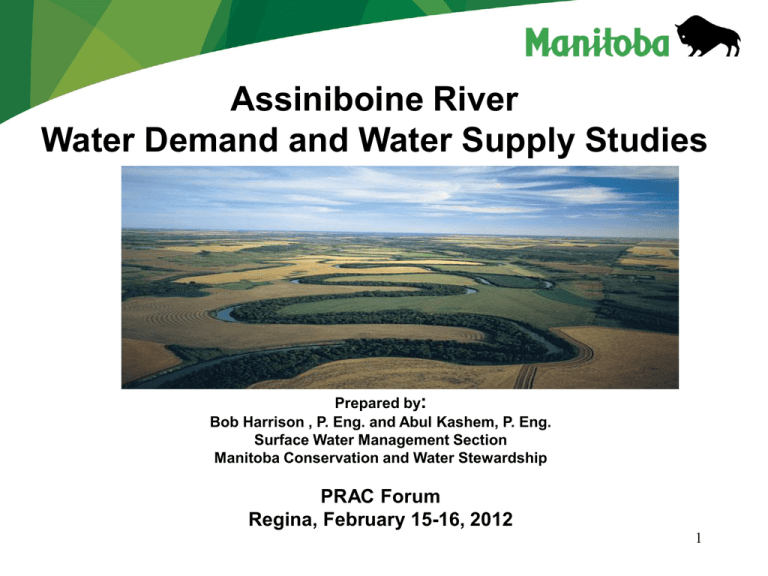
Assiniboine River Water Demand and Water Supply Studies Prepared by: Bob Harrison , P. Eng. and Abul Kashem, P. Eng. Surface Water Management Section Manitoba Conservation and Water Stewardship PRAC Forum Regina, February 15-16, 2012 1 Outline Background Purpose Socio-economic factors Climate change Projections Studies Water Demand Water Supply 2 Background Manitoba portion of Assiniboine River is a major source of water for municipal agricultural, industrial, La Salle Diversion, and recreational water uses. 3 Background Manitoba flows are regulated by Shellmouth Dam a multi-purpose facility operated for flood control and water supply. Assiniboine River / Shellmouth Reservoir system firm yield is about 112,500 acre-ft. (with 16,000 acre-ft potentially reserved for instream flows). Current 82,000 acre-ft. is allocated Irrigation largest use (about 25%). Shellmouth Dam Purpose Water demand study was to project future water uses with and without climate change (Genivar). Water supply study was to assess the potential effects of climate change on surface water supply and soil moisture (Stantec). 5 Socio-economic Factors Future: stable agriculture based economy Growth rate: medium 0.66% / year based on 1991 to 2006. 6 Socio-economic Factors Provincial Attributes: Weathered global recession Diversified economy Strong resource sector led by agriculture, hydro and mining. Strong immigrant program. Comparatively inexpensive and renewable energy sources – hydro, wind. . 7 Socio-economic Factors Study Area Attributes: Well serviced, affordable, welcoming communities. Water availability for domestic, municipal industrial and agricultural use. Superior soils within the lower Basin. Location along Asia-Pacific Trade Corridor. Ready access to American mid-west markets. Well positioned to respond to global food shortages. 8 Future Climate Change Projection Temperatures Expected to increase Winter: between 2-6°C Spring: between 1-4°C. Summer: between 1.5-5°C. Fall: between 2-5°C. Precipitation Reductions are predicted for the summer season, with reductions growing with time for this season. Increases are predicted for the other three seasons, with the largest increases in the spring. 9 Future Climate Change Projection General More frost-free days are anticipated. Earlier seeding opportunities by approximately two to three weeks. Increased potential for spring flooding. Increased potential for summer droughts. CRCM model domain 45X45km 10 Water Demand Study Review of existing water use/demand, Conduct a “visioning process”. Quantified the sectoral water demand for the Assiniboine River for the periods 2010, 2020, 2050 and 2080 through an analysis of population, economic growth, agricultural trends and climate change. Report prepared on projected demands. 11 Water Demand Study 12 Conclusions: Water Demand Study Water demand will continue to increase over the study period, and may exceed the firm annual yield. Climate change is predicted to strongly affect water demand from the river. In scenarios run without climate change, water demand exceeds available yield by 2080. Under the climate change scenarios examined, irrigation demand will be dramatically higher than planning accounts for by 2050. More study is needed to determine the potential for peak usage in months when river flows are low. 13 Conclusions: Water Demand Study The instream ecological needs of the river are not well quantified and should be studied further. Accessing easy to use climate projection data was a challenge. A region-specific climate projection data inventory is currently not available or accessible to the public, but if available would be a very important resource for assessors and in adaptation planning efforts. 14 Water Supply Study Modelled the hydrologic aspects of climate change based on the Canadian Regional Climate Model (CRM) run “aet”. Used DHI MIKE-SHE computer model. Model calibrated and verified for the periods from 1961 to 1990 and 1991 to 2003 respectively through comparison of unregulated simulated and observed flows Compared historical data to modelled climate change scenario data. Cautionary Note: There is breath of uncertainty as 15 only one CRM model run (aet) assessed. Surface Water Reviewed the natural mean monthly historical streamflow variability at Headingley for three periods. Compared future streamflow scenarios for: 2011-2040, 20412070, 2071-2099 to historic . ASSINIBOINE RIVER ANNUAL FLOW DURATION CURVE % of time less than Future scenarios are within historical natural variation, and no significant trend is apparent. 16 Soil Moisture Manitoba basin: soil moisture would not decline significantly until a later 21th century (2071). % of time less than Souris River basin: soil moisture will generally become drier in future, the lowest value in the latter third of the 21st century. % of time less than Qu’Appelle River Sub-basin: soil moisture will decrease in the first third and the last third and increase in the second third of the 21st century. 17 % of time less than Conclusions: Water Supply Study Predicted warmer summers and falls leading to higher evapotranspiration and a resulting decline in soil moisture. The greatest decline is predicted to take place after 2070. Predicted lower summer and fall soil moisture with no change in the spring soil moisture. Historic year to year and decade to decade variation in stream-flow has been large. Future flow variation will not be significantly different than in the past. Soil moisture is an important driver of streamflow in the prairies: model predictions of declines in soil moisture in late summer and fall have the potential to decrease streamflow in the spring. 18 Conclusions: Water Supply Study Soil moisture is predicted to decrease more towards the later part of the century, most noticeably in the western part of the basin. Soil moisture is one of the key drivers in generating runoff and stream flow. Higher soil moisture in fall generates higher spring runoff (for example 2011 flood). Future extreme floods may be slightly higher than in the past. 19 Questions 20

