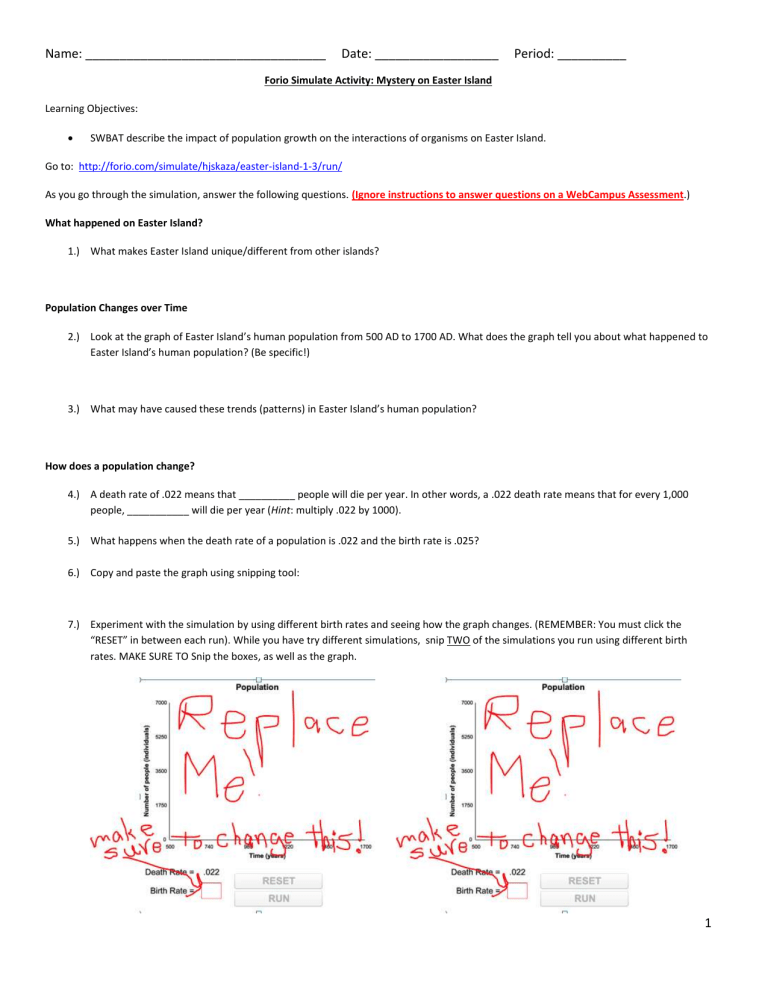
Name: ___________________________________ Date: __________________ Period: __________ Forio Simulate Activity: Mystery on Easter Island Learning Objectives: SWBAT describe the impact of population growth on the interactions of organisms on Easter Island. Go to: http://forio.com/simulate/hjskaza/easter-island-1-3/run/ As you go through the simulation, answer the following questions. (Ignore instructions to answer questions on a WebCampus Assessment.) What happened on Easter Island? 1.) What makes Easter Island unique/different from other islands? Population Changes over Time 2.) Look at the graph of Easter Island’s human population from 500 AD to 1700 AD. What does the graph tell you about what happened to Easter Island’s human population? (Be specific!) 3.) What may have caused these trends (patterns) in Easter Island’s human population? How does a population change? 4.) A death rate of .022 means that __________ people will die per year. In other words, a .022 death rate means that for every 1,000 people, ___________ will die per year (Hint: multiply .022 by 1000). 5.) What happens when the death rate of a population is .022 and the birth rate is .025? 6.) Copy and paste the graph using snipping tool: 7.) Experiment with the simulation by using different birth rates and seeing how the graph changes. (REMEMBER: You must click the “RESET” in between each run). While you have try different simulations, snip TWO of the simulations you run using different birth rates. MAKE SURE TO Snip the boxes, as well as the graph. 1 Name: ___________________________________ Date: __________________ Period: __________ What does carrying capacity have to do with it? 8.) OTHER than palm trees, what are 3 other resources that might have been limited on Easter Island? 9.) What is carrying capacity? Explain, don’t just define. 2 Name: ___________________________________ Date: __________________ Period: __________ 10.) Again, try changing the birth rates and see what happens to the corresponding graphs. This time, you are looking at two different graphs: Human population on Easter Island & Number of Coconut Palms on Easter Island. Snip TWO simulations you ran using different birth rates. This time, use a birth rate higher than .025 and lower than .025. Birth rate higher than .025 Birth rate Lower than .025 3 Name: ___________________________________ Date: __________________ Period: __________ Instead of clicking the “Take me to the article!” link, Google “NPR Easter Island” and click the first link that is titled “What Happened On Easter Island.” While reading the article, answer the following questions: 10.) What is slash-and-burn agriculture? 11.) Instead of fire, what do anthropologists Terry Hunt and Carl Lipo believe led to the downfall of Easter Island? 12.) What was Tang? Return back to the Forio Simulate website. Moai Statues 13.) What is one theory about how the people on Easter Island transported Moai statues? 14.) On the last page of the Forio Simulate, you now have 3 different graphs. Again, try changing the birth rates and see what happens, but this time, you are also able to change the rate of Moai statue construction. Try the three different levels of Moai construction to: “none,” “a little” or “a lot.” What happened? Conclusion 15.) What happens to a population when its birth rate is higher than its death rate? When its birth rate is lower? 16.) How did the population of humans on Easter Island affect the number of coconut palms on Easter Island? What might this tell you about the relationship between population growth and limited resources? Hint: Some sentence starters you may use: When the birth rate of a population is higher [or lower] than its death rate… The amount of resources available in an ecosystem can affect a population’s ability to grow because… 4
