Economics 101 Name ___________________________________ Summer 2009
Economics 101
Summer 2009
Answers to Quiz #3
June 9, 2009
Name ___________________________________
Time and Day of Discussion Section ___________
1. Suppose you are considering the demand for apples and the demand for all fruit.
Holding everything else constant, the demand for apples will be a. More elastic than the demand for all fruit. b. Less elastic than the demand for all fruit.
2. Provide a verbal explanation in support of your answer to #1.
The demand for apples will be more elastic than the demand for all fruit since there are many substitutes for apples and very few substitutes for all fruit. The more substitutes there are for a product, the more elastic that product's demand curve will be.
3. Answer this question using the demand schedule information given in the table below.
Assume the demand for widgets is linear.
Price per Widget Quantity of Widgets Demanded
100
80
20
40
Given this demand curve, the price that results in maximum consumer expenditure on widgets is a. $100. b. $80. c. $60. d. $40.
4. Suppose that when income increases by 10%, Bob's demand for good X increases by
5%. You can conclude from this information that a. Good X is a normal good. b. Good X is an inferior good.
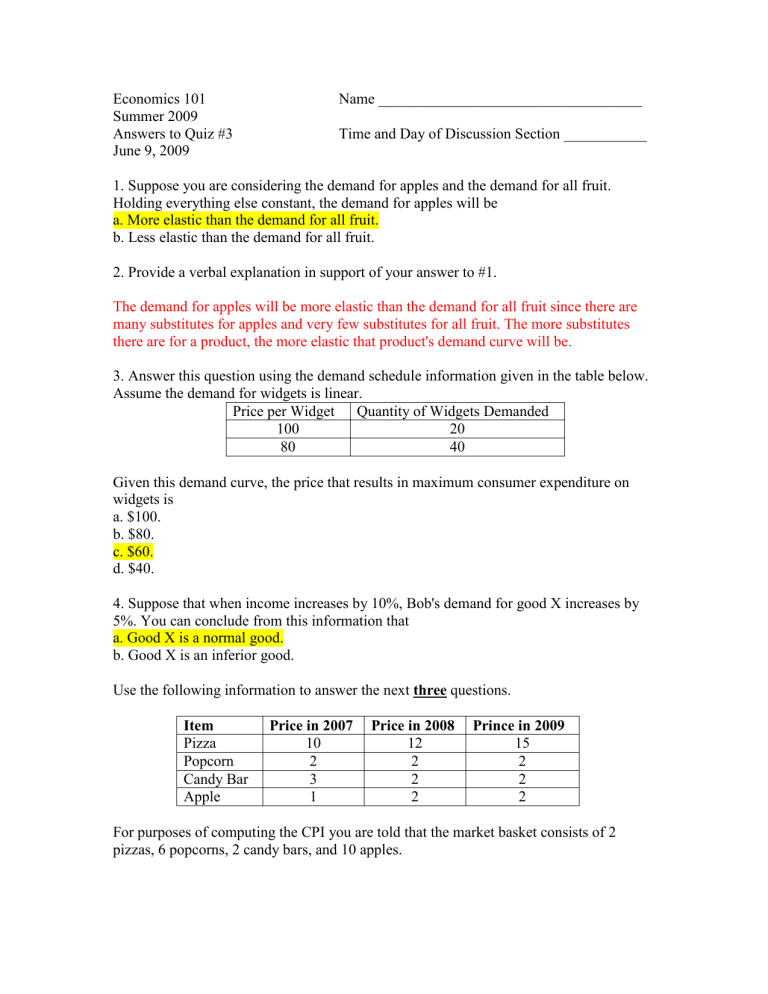
Use the following information to answer the next three questions.
Item
Pizza
Popcorn
Candy Bar
Price in 2007 Price in 2008 Prince in 2009
10
2
3
12
2
2
15
2
2
Apple 1 2 2
For purposes of computing the CPI you are told that the market basket consists of 2 pizzas, 6 popcorns, 2 candy bars, and 10 apples.
5. Calculate the CPI for 2007, 2008, and 2009 using 2008 as the base year. Fill in the following table. Use a 100 point scale for your CPI measure. Show your work in the space next to the table.
Year CPI
2007 80
2008 100
2009 110
2007: 2(10) + 6(2) + 2(3) + 10( 1) = 48
2008: 2(12) + 6(20) + 2(2) + 10(2) = 60
2009: 2(15) + 6(2) + 2(2) + 10(2) = 66
CPI for 2007 = (cost of market basket in 2007) /(cost of market basket in base year) * 100
= 48/60 * 100 = 80
CPI for 2008 = 100 since 2008 is the base year
CPI for 2009 = (cost of market basket in 2009)/(cost of market basket in base year) * 100
= 66/60 * 100 = 110
6. Calculate the rate of inflation between 2008 and 2009 based upon the above information and using the CPI as your measure of the price level. Show your work.
(110 -100)/100 *100 = 10%
The rate of inflation between 2008 and 2009 = _______________ 10% ________
7. Suppose you live in the economy depicted in the above information and your nominal salary in 2008 is $20,000 a year. Your boss tells you she is going to increase your nominal salary to $23,000 in 2009. This nominal increase in salary will a. Increase your purchasing power. b. Decrease your purchasing power.
Use the following table to answer the next three questions.
Labor Capital Output Variable Cost Fixed Cost Total Cost
0
1
2
3
4
10
10
10
10
10
0
10
15
18
20 $8
$10
8. What is the price of labor given the above information? Make sure you identify completely the units of measurement in your answer.
The price of labor = _________ $2 per unit of labor ______________
9. What is the price of capital given the above information? Make sure you identify completely the units of measurement in your answer.
The price of capital = _________ $1 per unit of capital __________________
10. What is the average cost of producing 10 units of output? Make sure you identify completely the units of measurement in your answer and that you show your work.
Average cost of 10 units of output = _________ $1.20 per unit of output _____________
