Project 3 – Phase 3 Google Analytics Results Andre Hartman

Andre Hartman
Project 3 – Phase 3
Google Analytics Results
Within a week, your site should get some traffic. The report of this traffic will be found on the dashboard of your site as well as the Google site. Take your screen shot of the main analytics page (from the Google site) and paste it to a word document. In addition to this screen shot, include the following items:
1.
Visit the Google site and analyze the total visits, bounce rate, traffic sources, and page views on your site. Write a short paragraph summarizing the specific numbers and what they mean (not the definitions of these fields but what the data is telling you).
2.
List three specific changes you can make to your site to increase the total visits.
3.
Write a short paragraph which explains how you could use this tool in the future to help you distribute information or sell products/services on the web more effectively.
1
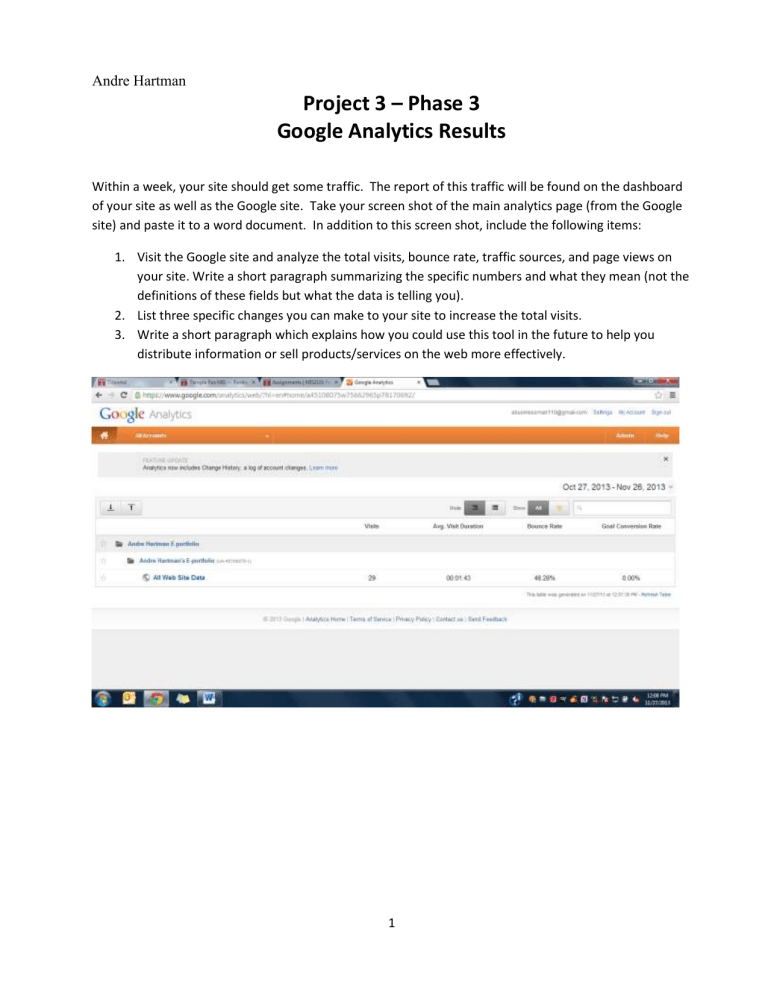
In summary, the total visits, bounce rate, traffic sources and page views of my e-portfolio site shows that I could have done a much better job of increasing my site’s awareness and the level of interaction. Although 29 visits, is not a bad number it can be much higher than that; I can improve that number by honing in on keywords that will increase the likelihood of my site’s appearance in search engines, actively engaging in conversation about my site amongst my peers and by increasing my site’s awareness through the use of social media. Traffic sources shows 0 keywords which illustrates that no one found my site through the use of a search engine; the
2
visits that I received were from me sending out an email to the class asking them to visit my site.
A bounce rate of 48.28% shows that a nice amount of people who visited my site were not interested enough to click around to find more about what I had to offer; I can improve that number by creating a video of me introducing myself to the world on the landing page, adding more colors and font styles to make my site more appealing and engaging. 84 page views is a good number in comparison to the visits that I received which shows that some people clicked around on different pages multiple amounts of time.
If I were interested in using Google Analytics in the future, it would be a great way to distribute information or sell products/services on the web more effectively. Google Analytics allows you to see whether you are doing a good job promoting your site’s awareness through the number of visitors that you receive, if you have the right keywords included in your site’s content
(traffic sources), and whether the users are engaged enough to stay past the landing page
(bounce rate and page visits). Since all of the information is collected via real-time, it allows you to make changes immediately and see the actual results that it produces in a timely fashion.
Based upon that information, you can decide on what you would like to do differently and what you would like to keep the same.
3


