Lab 11
advertisement
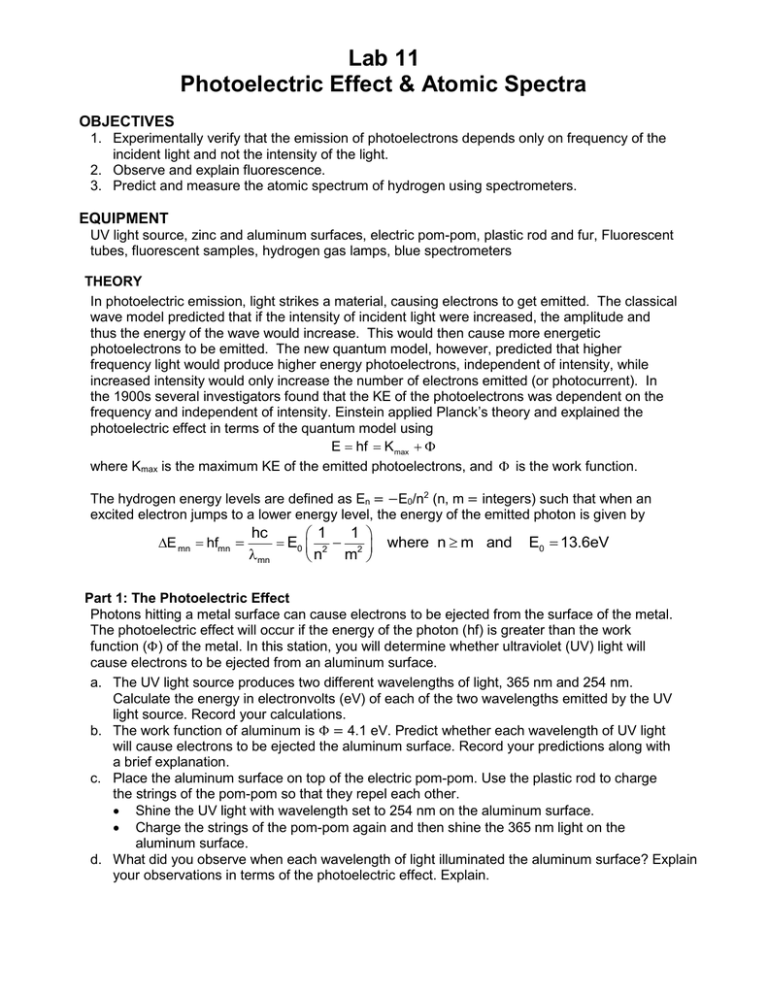
Lab 11 Photoelectric Effect & Atomic Spectra OBJECTIVES 1. Experimentally verify that the emission of photoelectrons depends only on frequency of the incident light and not the intensity of the light. 2. Observe and explain fluorescence. 3. Predict and measure the atomic spectrum of hydrogen using spectrometers. EQUIPMENT UV light source, zinc and aluminum surfaces, electric pom-pom, plastic rod and fur, Fluorescent tubes, fluorescent samples, hydrogen gas lamps, blue spectrometers THEORY In photoelectric emission, light strikes a material, causing electrons to get emitted. The classical wave model predicted that if the intensity of incident light were increased, the amplitude and thus the energy of the wave would increase. This would then cause more energetic photoelectrons to be emitted. The new quantum model, however, predicted that higher frequency light would produce higher energy photoelectrons, independent of intensity, while increased intensity would only increase the number of electrons emitted (or photocurrent). In the 1900s several investigators found that the KE of the photoelectrons was dependent on the frequency and independent of intensity. Einstein applied Planck’s theory and explained the photoelectric effect in terms of the quantum model using E hf K max where Kmax is the maximum KE of the emitted photoelectrons, and is the work function. The hydrogen energy levels are defined as En = −E0/n2 (n, m = integers) such that when an excited electron jumps to a lower energy level, the energy of the emitted photon is given by E mn hfmn hc 1 1 E0 2 2 where n m and mn n m E0 13.6eV Part 1: The Photoelectric Effect Photons hitting a metal surface can cause electrons to be ejected from the surface of the metal. The photoelectric effect will occur if the energy of the photon (hf) is greater than the work function (Φ) of the metal. In this station, you will determine whether ultraviolet (UV) light will cause electrons to be ejected from an aluminum surface. a. The UV light source produces two different wavelengths of light, 365 nm and 254 nm. Calculate the energy in electronvolts (eV) of each of the two wavelengths emitted by the UV light source. Record your calculations. b. The work function of aluminum is Φ = 4.1 eV. Predict whether each wavelength of UV light will cause electrons to be ejected the aluminum surface. Record your predictions along with a brief explanation. c. Place the aluminum surface on top of the electric pom-pom. Use the plastic rod to charge the strings of the pom-pom so that they repel each other. Shine the UV light with wavelength set to 254 nm on the aluminum surface. Charge the strings of the pom-pom again and then shine the 365 nm light on the aluminum surface. d. What did you observe when each wavelength of light illuminated the aluminum surface? Explain your observations in terms of the photoelectric effect. Explain. Part 2: The Atomic Spectrum of Fluorescent Lights a. Look at the fluorescent lights with the blue spectrometers. Write down the wavelengths of the most prominent lines you can see, along with their colors. (Some will be smeared so just do the best you can). b. Using the jpg image of the spectra of different gases, (i) identify the wavelengths you observed and determine what gas (es) are in the fluorescent bulbs. You might not find all the lines in the list of gases − if not, discuss where these lines might come from. (ii) Which ones (color and wavelength) were not found among the list of gases? Part 3: Fluorescence Look at the fluorescent samples that are set up. For each sample, describe what range of incoming wavelengths will cause it to fluoresce. Notice the spectrum of the fluorescent light from each sample? Is it a discrete wavelengths or a range of wavelengths? Describe and comment. a. What is Fluorescence? What is Two-photon absorption? Hint: Wikipedia b. Look at the fluorescent samples that are set up. For each sample, describe what range of incoming wavelengths will cause it to fluoresce. Notice the spectrum of the fluorescent light from each sample? Is it a discrete wavelengths or a range of wavelengths? Describe and comment. Part 4: Hydrogen Atomic Transitions a. Using the hydrogen energy levels, create an Excel table that predicts all of the visible photon wavelengths for all jumps for the first 5 electron energy jumps. Setup the columns of n, m, (nm), Spectrum, and Color. b. Which visible wavelength are observable in the hydrogen atomic spectrum? c. Use the calibrated blue spectrometers to identify the color and measure the wavelengths of the observed atomic spectrum of hydrogen. d. Compare the measured and predicted wavelengths using a percent difference. How do they compare?
