4700c5chewexans.docx
advertisement
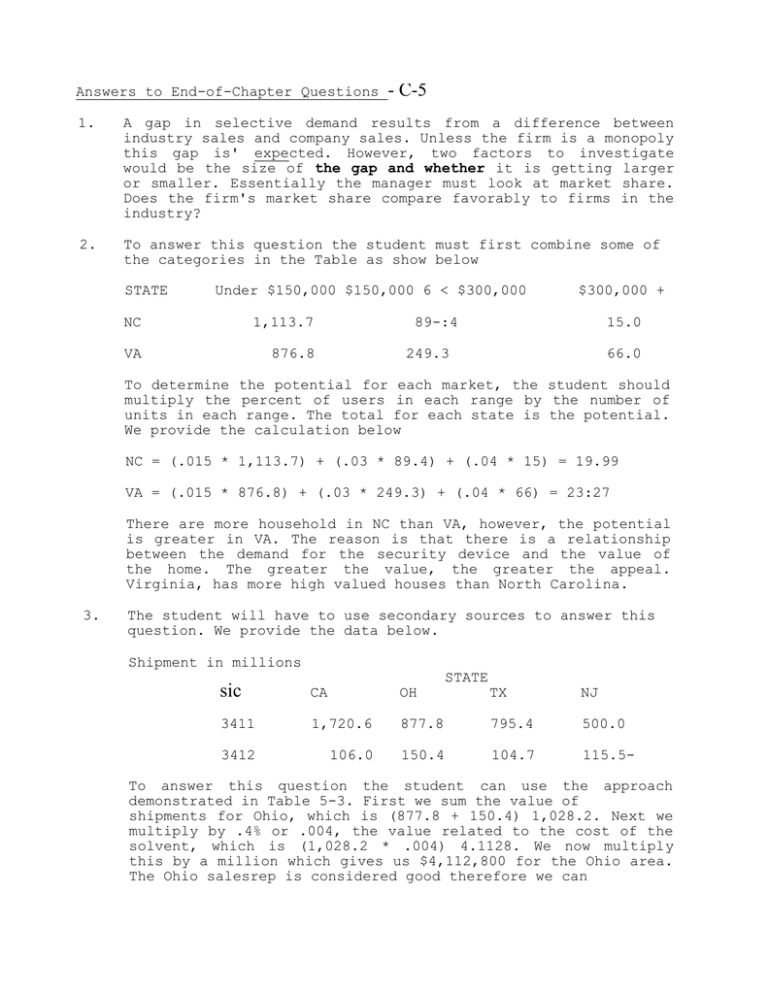
Answers to End-of-Chapter Questions - C-5 1. A gap in selective demand results from a difference between industry sales and company sales. Unless the firm is a monopoly this gap is' expected. However, two factors to investigate would be the size of the gap and whether it is getting larger or smaller. Essentially the manager must look at market share. Does the firm's market share compare favorably to firms in the industry? 2. To answer this question the student must first combine some of the categories in the Table as show below STATE Under $150,000 $150,000 6 < $300,000 NC 1,113.7 VA 876.8 $300,000 + 89-:4 15.0 249.3 66.0 To determine the potential for each market, the student should multiply the percent of users in each range by the number of units in each range. The total for each state is the potential. We provide the calculation below NC = (.015 * 1,113.7) + (.03 * 89.4) + (.04 * 15) = 19.99 VA = (.015 * 876.8) + (.03 * 249.3) + (.04 * 66) = 23:27 There are more household in NC than VA, however, the potential is greater in VA. The reason is that there is a relationship between the demand for the security device and the value of the home. The greater the value, the greater the appeal. Virginia, has more high valued houses than North Carolina. 3. The student will have to use secondary sources to answer this question. We provide the data below. Shipment in millions STATE sic CA OH TX NJ 3411 1,720.6 877.8 795.4 500.0 3412 106.0 150.4 104.7 115.5- To answer this question the student can use the approach demonstrated in Table 5-3. First we sum the value of shipments for Ohio, which is (877.8 + 150.4) 1,028.2. Next we multiply by .4% or .004, the value related to the cost of the solvent, which is (1,028.2 * .004) 4.1128. We now multiply this by a million which gives us $4,112,800 for the Ohio area. The Ohio salesrep is considered good therefore we can calculate a reasonable pergentage by dividing this reps sales by the total sales: 1,250,OOOJ4,112,800 = 30.39. We could then set quotas for the other states as being 30.39$ of total potential. These quotas, in millions, would be: CA = 2.22 TX = 1.09 NJ = 0.75 4. The budget is $5 million and the task is to allocate it proportionally to construction and manufacturing for the four geographic regions. Construction accounted for 65$ of the past business and will therefore receive a budget of $3,250,000, 65$ of the $5 million budget. Manufacturing will receive the remaining $1,750,000. The allocation will be based on the proportion of employs (by industry) by the geographical regions: These proportions are reported below: REGION INDUSTRY CONSTRUCTION MANUFACTURING Northeast 16.4 19.8 Midwest 23.1 30.0 South 38.8 33.0 West 21.7 17.2 The budget allocations are: REGIONS INDUSTRY CONSTRUCTION Northeast $ 533,000 Midwest South West 5. MANUFACTURING $346,500 750,750 525,000 1,261,000 577,500 705,250 301,000 The first step is to calculate-the survival rate Year of Purchase 1996 1995 1994 1993 Age of Product 1 2 3 4 Units Scrapped Survival in 1996 Rate 15$ 25$ 50$ 100$ 85$ 75$ 50$ 0$ Units Remaining end of 1996 85$ 64$ 32$ 0$ Now the replacement potential can be calculated Year Industry Percent Left Product Sales at start of was sold (in 000'x) 1997 1996 5,250 85 1995 6,479 64 1994 4,890 32 1993 4,798 0 Number Left at start of 1997 4,462 4,146 1,564 Annual Scrapping Rate 15 25 50 0 1997 Replacement Potential 669 1,036 782 2,487 6. There are two important factors to consider when formulation a multiple-corollary index: (1) what factors are to be measured and will they be of equal weight. Notice that the Buying Power Index, a famous multiple-corollary index, uses three factors: People, Money and the-.willingness to spend, and the weights are .5 for income, .3 for retail sales, and .2 for population. 7. Here the students will calculate a BPI for the six New England states. The calculations are provided-below. In each case we first must get the percent of the O. S. for .the three measures and then use the following formula BPI = (.5) ($ Income) + (.3) ($ Retail Sales) + (.2) ($ Population) RETAIL INCOME .0169 _ .0043.0269 .0050 .0037 .0012 STATE CT ME MA NH RI VT SALES .0144 - .0052 .0234 .0057 .0034 .0040 POPULATION .0120 .0047 .0231 .0044 .0038 .0022 BPI .0152 .0046 .0251 .00511. .0036 .0018 The rankings would be RANK 1 2 3 4 5 6 8. STATE MA CT NH ME RI VT BPI .0251 .0152 .0051 .0046 .0036 .0018 Atop-down approach means that top management set and quotas and these are passed onto the sales salespeople in the territories. Top management perspective on corporate goals and objectives, but sales goals managers and has a good is removed from the field. There may be some extenuating circumstances that would call for the forecast to be either too optimistic or too pessimistic. For example, top management may not be aware of all recent actions by the competition or changing social/demographic characteristics in specific territories. Alternatively, a bottom-up approach begins with the salespeople in the field setting goals for their territories and then aggregating these forecast until there is one number for the corporation. A useful approach, as described by UPS in the chapter, is to use both a top-down and a bottom-up approach. The estimates keep going back and forth until a forecast that is acceptable to both salespeople and management is determined. 9. We have provided the forecasts below. SINGLE MOVING AVERAGES: ACTUAL YEAR VALUE 3-YEAR FORECAST VALUE ERROR 1986 1987 1988 1989 1990 1991 1992 1993 1994 1995 1996 41091.67 47213.33 51468.33 54551.64 59223.33 63426.67 69260.00 72630.00 34400.00 42125.00 46750.00 52765.00 54890.00 56000.00 66780.00 67500.00 73500.00 76890.00 11673.33 7676.67 4531.67 12228.33 8276.67 10073.33 7630.00 EVALUATIVE MEASURES: SUM OF FORECAST ERRORS = 62090.0000 AVERAGE FORECAST ERROR = 8870.0000 VARIANCE = 6102848.5000 STANDARD DEVIATION =-2470.3945 MEAN ABSOLUTE ERROR = 0.1406 SINGLE EXPONENTIAL SMOOTHING: ACTUAL YEAR VALUE 3-YEAR FORECAST VALUE ERROR 1986 34400.00 1987 42125.00 1988 46750.00 1989 52765.00 1990 54890.00 34400.00 39035.00^43664:0 49124.60 7725.00 7715.00 9101.00 5765.40 1991 1992 1993 1994 1995 1996 56000.00 66780.00 67500.00 73500.00 _ 76890.00-` 52583.84 54633.54 61921.41 65268.57 74216.97 74216.97 3416.16 12146.46 5578.59 8231.43 6682.57 EVALUATIVE MEASURES: SUN OF FORECAST ERRORS = 66361.6094 AVERAGE FORECAST ERROR = 7373.5122 VARIANCE = 5409708.0000 STANDARD DEVIATION = 2325.8779 MEAN ABSOLUTE ERROR = 0.1278 REGRESSION: - ACTUAL YEAR VALUE 3-YEAR FORECAST VALUE ERROR 1986 1987 1988 1989 1990 1991 1992 1993 1994 1995 1996 36734.36 41273.39 45812.43 50351.45 54890.48 59429.52 63968.55 68507.58 73046.61 77585.64 34400.00 42125.00 46750.00 52765.00 54890.00 56000.00 66780.00 67500.00 73500.00 76890.00 -2334.36 851.61 937.58 2413.54 -0.49 -3429.52 2811.45 -1007.58 453.39 -695.64 EVALUATIVE NEASURES: SUN OF FORECAST ERRORS = -0.0049 AVERAGE FORECAST ERROR = -0.0005 VARIANCE = 3424927.2500 STANDARD DEVIATION = 1850.6559 MEAN ABSOLUTE ERROR = 0.0287 10. The estimate is 14 million units with a standard error of 1,560,000. Therefore there is a 95$ chance that sales will be within (+/- 2 standard errors) the range of 10,880,000-to.17,120,000. Based on the information in the question, we would recommend producing on the high side. The product is not perishable, therefore it can be stored if we overproduce. There will be inventory costs, however, notice that the contractors will switch if it is not in stock. Therefore the cost of losing business is probably greater than the cost of inventory. LAVACA FABRIC MANUFACTURING COMPANY Lavaca Fabric Manufacturing Company manufactures and markets allcotton "wipe rags" used by wey11-servicing firms and oil producing firms to clean the cables and push-rods used in lifting crude oil to the surface by oil well pumps. Wipes, when saturated with a cleaning solvent, remove materials collected on the cables and push-rods. On the average, 4 wipes are used per well per week. Hundreds of thousands of these wipes are used annually by the oil and gas industry world-wide. Last year Lavaca, a major supplier of wipes, captured about 214 of an estimated $5,000,000 international wipe rag market. Wipes are sold in 2o-pound cartons with 80 wipes per carton to well-servicing firms and oil producing firms by oil field supply firms located near the producing oil fields. Lavaca markets its wipes through industrial distributors who sell to the oil field supplier. The industrial distributor maintains a markup of 433 on its cost of goods, while the oil field supply firm typically maintains a markup of 38$ on its selling price. Wipe rags are sold to the oil and gas industry in four qualities depending on the density of the weave and the denier or thickness of the thread used in its manufacture. Well-servicing firms choose one of these qualities depending on the properties of the crude oil in an oil field. The schedule of prices paid by well-servicing and other user firms is given below. Best Quality: Better Quality Good Quality Standard Quality Price per Carton Percent of Total Sales $64.00 $50.00 $44.00 $28.00 208 40$ 25$ 15$ Lavaca has manufactured wipes for over fifty years and has a good cost accounting system that accurately estimates the costs of manufacturing and marketing their wipe rages, Lighthouse brand. Although Lavaca has varying costs for each quality of wipe rag, management has generalized its manufacturing unit variable cost. to be $0.1375 per rag. Wipe rags are shipped in boxes that when properly utilized allows the oil field supply firm to convert it to a point-of-sale: display that holds 20 cartons of wipes. The display/shipping boxes are purchased from a paper products vendor for $129.60 per bundle containing 6 dozen boxes. Direct manufacturing costs such as ,inventory carrying costs and depreciation on transportation equipment total approximately $160,000 annually. Additionally, it is anticipated that Lavaca's direct manufacturing costs for the coming year will increase by $20,000. Lavaca sells to industrial distributors using a small sales force of four field sales representatives and an in-house telephone sales person located at the home office who takes telephone orders and sells direct to its international accounts. About 10% of Lavaca's sales come from international customers. The four field representatives earn a 4$ commission-on their sales to industrial distributors plus a base salary of $3,000 per month. The in-house telephone sales person is paid a salary of $1,500 per month. and a year-end bonus of $2,000 if Lavaca achieves its in-sales goal. It should be noted that the sales goal has always been achieved. Lavaca markets primarily in Texas, Louisiana, New Mexico and Oklahoma. A small competitor of wipe rags recently went out of business and leaving an opportunity for Lavaca in the Kansas, Colorado and Wyoming market. If Lavaca should decide to enter this market they know they will incur some up-front costs for working capital and fixed assets, primarily the cwt of borrowing working capital, purchase of anew delivery truck for about $80,000, and the cost of supporting a new sales person to cover the area including an automobile costing $16,000. The imputed cost of borrowing working capital and purchasing the truck and car for this market expansion effort is estimated to be nearly $7,000 annually. The new sales person will be compensated the same as the other four field sales representatives; however, there is an up-front training cost of $15,000. The new truck and automobile are amortized on a straight-line 4-year schedule. Question: If Lavaca elects to enter the new market what is the required level of dollar sales necessary to earn the same rate of return of contribution to margin to sales as last year? To arrive at this answer you will need to answer the following about last year's operation: a. b. c. d. Lavaca's unit selling price Lavaca's uvcm and.pvcm Lavaca's contribution to margin (CTM) Lavaca's rate of return (ROR) on CTM to Sales Question: The small competitor who went out of business in the Kansas, Colorado and Wyoming markets reported it had generated $180,000 in wipe rag sales last year. You also know that there are approximately 15,000 producing oil wells in this market. Given this information should Lavaca enter the market? Why do you say this? LITTLE DOMINIC'S 1. As indicated belt, Griffith can use four corollary factors, each of which provides very -comparable estimates of relative market potential. The only noticeable difference among the four is that Louisville has a slightly larger relative potential and Dayton a slightly lower one when retail sales of eating and drinking establishments are used. This may reflect the fact that Louisville restaurants draw relatively more customers (and Dayton restaurants draw -relatively fewer customers) from outside the SKSA. However, it is not likely that pizza parlors will benefit from this information as much as larger restaurants. Percentaaes of Six-Market Totals Eating Drinking BPI Population Under-34 population Indianapolis Louisville Evansville Cincinnati Columbus Dayton 2. 20.0 15.8 4.7 23.4 21.0 15.3 19.6 16.0 4.7 23.2 21.0 15.4 Estab. Sales 19.7 15.9 4.5 23.1 21.7 15.1 Additional information desired: • • • Are sales of pizza parlors the same as a percentage of eating and drinking establishment sales in all six markets? Does Little Dominic's have the same share in each market (i.e., is it a "star" in some markets but a "problem child" in others)? Competitive spending levels (the value of this information is discussed in Chapter 6). - 19.2 17.4 4.9 23.5 21.3 13.8 ACHE GLOVE 1. County Estimated Harris 70 Tulsa, Oklahoma 25 Denver, Colorado 25 Midland, Texas 33 Oklahoma, Oklahoma 45 Dallas, Texas 22 Natrona, Wyoming 31 LaFayette, LA 23 Caddo, Louisiana 29 Sedgevick, Kansas 47 Total 350 Total U.S. 1126 Average Total Gloves EmployEstimate ment 1495 1167 910 625 462 870 565 719 503 291 8,720 2,432 1,896 1,720 1,733 1,596 1,462 1,379 1,2-16 1.140 23,294 48,825 Percent in Gloves U.S. (12 per Emp.) 0.186 0.051 0.040 0.036 0.037 0.034 0.031 0.029 0.025 0.024 0.497 1.00 104,652 _- 29,184 22,756 20,640 20,796 19,152 17,544 16,548 14,592 13.680 279,540 585,900 Potential in Dollars: Top Ten 279,540 X $17 = $4,752;180 Total U.S. Q 17 $ 9,960,300 279,540 X $20 = $5,590,800 Total U.S. @ 20 $11,718,000 Average Gloves per Establishment: Top Ten 2. 279,540 + 350 = 799 585,900 s 1126 = 520 He `could be able to estimate the maximum level of sales Acme could obtain. TRIPLE CAST 1. Market potential could be estimated by assessing the number of ho=es that would be wired and the percentage that would watch non-prime time telecasts (a measure of willingness to buy). 2. NBC had no real experience in this category. Their judgment would not be as valuable as those of cable operators. Since the maxima buy rate from prior PPV telgcasts'-was 7.8$, that would seen to have been a reasonable starting'point. 3. While PPV itself may be projectible via diffusion modeling, a given event is not easily modeled this way. There is really no time for word-of-mouth communication for a single event. 4. The main cost of overestimation was the rights fees. NBC simply paid too much on the assumption that PP'V sales would be substantial. The other costs (equipment for wiring homes) could at least be used for future PPV adventure. The risk of underestimation was that NBC would bid too brand not receive the contract. = One might assume that this was the risk they wished to avoid. The 'forecast`- may even have been a wish to justify the desire to be the Olympic channel: LAVACA FABRIC MANUFACTURING COMPANY SOLUTION OBJECTIVES In addition to the typical profitability analysis exercise, this minicase asks the student to: 1. 2. 3. 4. Calculate a weighted average price. Backward price beginning with the user selling price to find the manufacturer's selling price. Covert percentage mark-up on cost to percentage mark-up on selling price. Calculate the rate of return on contribution to margin. and use this value to estimate the- new required level of sales. For the bonus question the student must: 5. 6. 1. Calculate market potential in units and dollars Compare current market share performance applied to a new market's potential against the required level of sales necessary to achieve the firm's profit objective. Lavaca's annual sales for the past year Industry sales Company market share Company sales 2. $5,000,000 21% $5,000',000 X .21 $1,050,000 Lavaca's manufacturing unit selling price (weighted average price) Product Price per Mstr. Crtn. Percent of • Tot. Sales Weighted Price Best Quality Better Quality Good Quality Standard Quality $64.00 $50.00 $44.00 $28.00 20$ 408 25$ 15$ $12.80 $20.00 $11.00 S 4.20 Weighted Average User Price (Oil Field Supply Selling Price)$48.00 Old Field Supply Dollar Markup (.38 m/u on selling price X $48.00) Industrial Distributor Selling Price Industrial Distributor Dollar Markup (.43$ m/u on cost converts to:.43/1.43) _ .3007 m/u on selling price X $29.76 Lavaca Manufacturing unit selling price 3. = Estimating Lavaca's UVCCM, PVCM, TVCM,CTX, & Rate of Return on CTM 18.24 $29.76 S 8.95 $20.81 Unit Variable Costs: Manufacturing: $0:1375 per wipe X 80 wipes = per master carton $11.00 marketing: Out side sales force sales = 90$ of total sales .04 Commission X .90 = .036 .036 X $20.81 = Display carton = $1.80/20 masters WC WCM ($20.81 - $11.84) PVCM ($8.97 = $20.81) $ .75 .09 $11.84 $ 8.97 43.1$ Total Variable Contribution to margin (TVCM): $1,050,000 X .431 = Direct Fixed Costs: Sales Force (4 people X $3,000/mo. X 12 months) _ In-house sales repr. ($18,000 + $2,000 bonus) + Manufacturing Contribution to margin (CTM) (Contribution to overhead & Profit) $452,550 $144,000 20,000 $160.000 $324,000 $128,550 Rate of Return on CTM to Total Revenue: (128,550 + $1,050,000) = 12.24$ Required level of sales to enter new market and achieve current rate of return on CTM of 12.243 Old Direct Fixed Costs: New Direct Fixed Costs: Manufacturing New sales person: salary Training Working Capital Depreciation on truck and car ($80,000 + $16,000) + 4 years = $324,000 $ 20,000 36,000 15,000 7,000 $_24.000 2S1~000 $426, 000 Required Level of Sales: gFC`+ CTM Oblg~rtiiye PVCM $426,000 + .1224 CTM .431 = $426.000 .3086 Additional required level of sales to enter the new market: ($1,380,428 - $1,050,000) = $1,380,428 $330,428 5. Should Lavaca enter the new market knowing the exiting company earned $180,000 in wipe sales last year? Market Potential: 80/carton = 39,000 15,000 well X 4 wipes/week X 52 weeks = Market Share: 39,000 master cartons X .21 (current share)8,910 cartons Expected Sales: 8,910 cartons @ $20.81 each = $170,000 Total revenue Lavaca should not enter the market if it plans to make these additional outlays and must soot the 12.24$ CRK profit objective. Required level of sales for the venture is over $330,000 and estimated revenue, given its current market share in the industry, is only $170,000.
