AbstractID: 6600 Title: The slope of the dose-response curve for... organs. The difference in the dose-response slopes between normal tissues (late-effects)...
advertisement

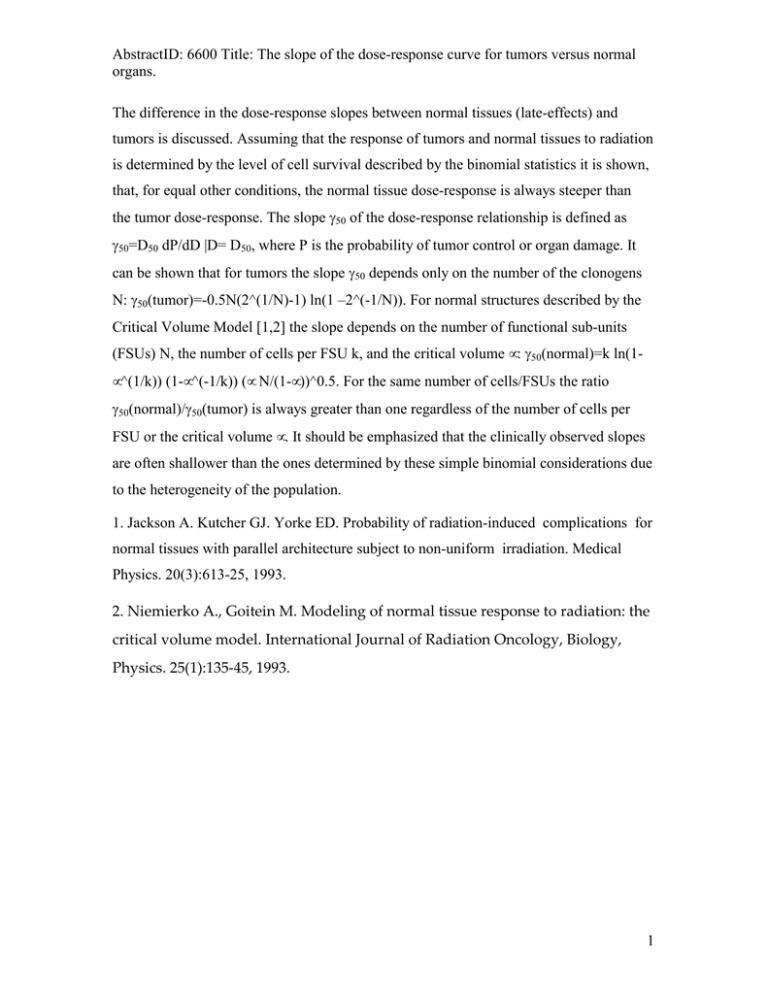
AbstractID: 6600 Title: The slope of the dose-response curve for tumors versus normal organs. The difference in the dose-response slopes between normal tissues (late-effects) and tumors is discussed. Assuming that the response of tumors and normal tissues to radiation is determined by the level of cell survival described by the binomial statistics it is shown, that, for equal other conditions, the normal tissue dose-response is always steeper than the tumor dose-response. The slope γ50 of the dose-response relationship is defined as γ50=D50 dP/dD |D= D50, where P is the probability of tumor control or organ damage. It can be shown that for tumors the slope γ50 depends only on the number of the clonogens N: γ50(tumor)=-0.5N(2^(1/N)-1) ln(1 –2^(-1/N)). For normal structures described by the Critical Volume Model [1,2] the slope depends on the number of functional sub-units (FSUs) N, the number of cells per FSU k, and the critical volume µ: γ50(normal)=k ln(1µ^(1/k)) (1-µ^(-1/k)) (µ N/(1-µ))^0.5. For the same number of cells/FSUs the ratio γ50(normal)/γ50(tumor) is always greater than one regardless of the number of cells per FSU or the critical volume µ. It should be emphasized that the clinically observed slopes are often shallower than the ones determined by these simple binomial considerations due to the heterogeneity of the population. 1. Jackson A. Kutcher GJ. Yorke ED. Probability of radiation-induced complications for normal tissues with parallel architecture subject to non-uniform irradiation. Medical Physics. 20(3):613-25, 1993. 2. Niemierko A., Goitein M. Modeling of normal tissue response to radiation: the critical volume model. International Journal of Radiation Oncology, Biology, Physics. 25(1):135-45, 1993. 1


