TABLE OF CONTENTS CHAPTER TITLE PAGE
advertisement
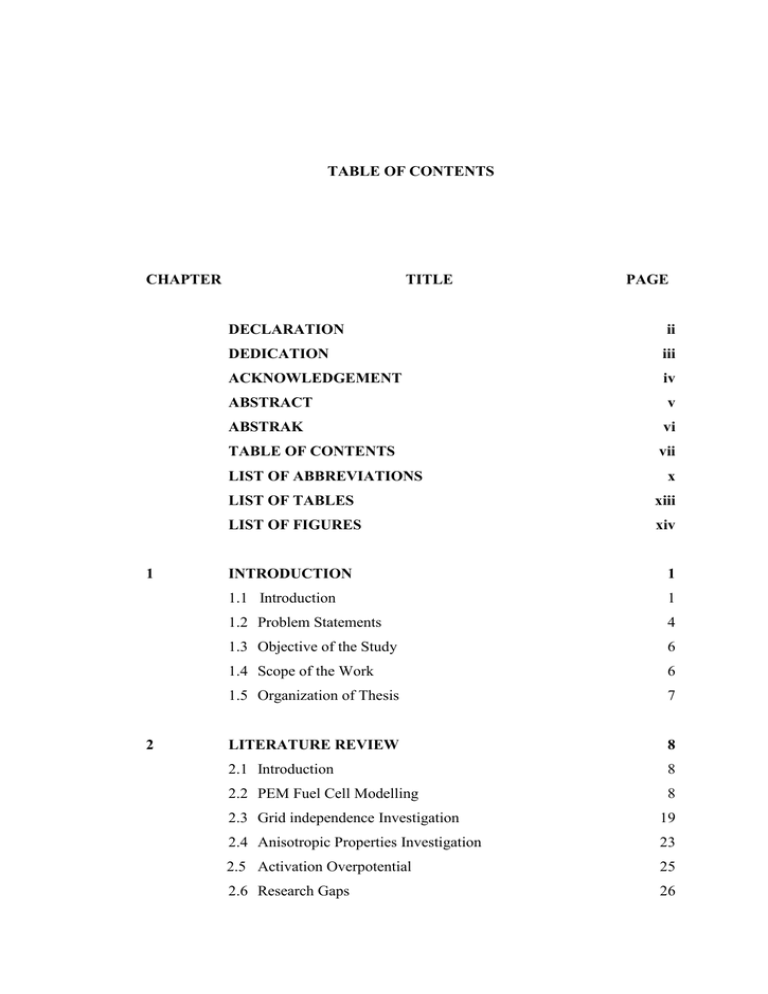
TABLE OF CONTENTS CHAPTER TITLE PAGE DECLARATION ii DEDICATION iii ACKNOWLEDGEMENT iv ABSTRACT v ABSTRAK vi TABLE OF CONTENTS vii LIST OF ABBREVIATIONS x LIST OF TABLES xiii LIST OF FIGURES xiv CHAPTER 1 1 1 INTRODUCTION 1 1.1 Introduction 1 1.2 Problem Statements 4 1.3 Objective of the Study 6 1.4 Scope of the Work 6 1.5 Organization of Thesis 7 CHAPTER 2 8 2 LITERATURE REVIEW 8 2.1 Introduction 8 2.2 PEM Fuel Cell Modelling 8 2.3 Grid independence Investigation 19 2.4 Anisotropic Properties Investigation 23 2.5 Activation Overpotential 25 2.6 Research Gaps 26 viii 2.7 Summary 27 CHAPTER 3 29 3 METHODOLOGY 29 3.1 Introduction 29 3.2 Problem definition (Step 1) 31 3.3 PEM Fuel Cell Modelling (Step 2) 31 3.3.1 Geometry Definition 31 3.3.2 Model Definition 33 3.3.3 Solution and Validation 37 3.4 Applications 40 3.4.1 Grid Analysis 40 3.4.2 Investigation of Anisotropic Properties 41 3.4.3 Activation Overpotential Approximation 41 3.5 Activation Overpotential Approximation Mathematical Analysis42 3.5.1 Introduction to Butler-Volmer Equation 42 3.5.2 Algebraic transformation 45 3.5.2.1 Reverse form of Butler-Volmer equation 3.5.2.2 New approximation derivation 3.6 Summary 45 48 50 CHAPTER 4 52 4 VALIDATION AND GRID INDEPENDENCE RESULTS 52 4.1 Introduction 52 4.2 Model Verification 52 4.2.1 Problem Definition 53 4.2.2 PEM Fuel Cell Modeling 53 4.2.2.1 Geometry Definition 4.2.2.2 Model Definition 4.2.3 Solution and Validation 53 55 57 4.3 Parametric Survey 59 4.3.1 Current Density Magnitude 59 4.3.2 Reactants and Product Concentration 61 4.3.3 Heat Ohmic Source 65 4.3.4 Activation Overpotential 66 4.3.5 Temperature 67 ix 4.3.6 Water Activity 68 4.4 Grid Independence Survey 69 4.4.1 Polarization Curve 69 4.4.2 Anode and Cathode Temperature 74 4.4.3 Ohmic Heat Source 77 4.4.4 Reactants and Product Concentration 79 4.5 Conclusion 83 CHAPTER 5 84 5 ANISOTROPIC PROPERTIES RESULTS 84 5.1 Introduction 84 5.2 Flooding Conditions 84 5.3 Effect of GDLs Anisotropic Electrical Conductivity 87 5.4 Effect of GDLs Anisotropic Thermal Conductivity 89 5.5 Effect of GDLs Anisotropic Permeability 94 5.6 Conclusion 95 CHAPTER 6 97 6 ACTIVATION OVERPOTENTIAL APPROXIMATION 97 6.1 Introduction 97 6.2 Activation Overpotential Results and Discussion 97 6.2.1 New form of Butler-Volmer equation 97 6.2.2 The K-J Approximation 99 6.3 Conclusion 112 CHAPTER 7 114 7 CONCLUSION 114 7.1 Summary 114 7.2 Conclusion 117 7.3 Future Work 117 REFERENCES 119 x LIST OF ABBREVIATIONS CAD - Computer Aided Design CFD - Computational Fluid Dynamic CL - Catalyst Layer EIS - Electrochemical Impedance Spectroscopy GDL - Gas Diffusion Layer HOR - Hydrogen Oxidation Reaction ORR - Oxygen Reduction Reaction PEM - Proton Exchange Membrane PEMFC - Proton Exchange Membrane Fuel Cell xi LIST OF SYMBOLS a - Water Activity Ach - Gas Channel Cross-Sectional Area Am - Membrane Active Area Ci - Concentration of Specie i Cp - Heat Capacity -D - Dimensional D - Effective Diffusion Coefficient e- - Electron E0 - Cell Thermodynamic Potential F - Faraday Constant H+ - Proton i - Current Density i0 - Exchange Current Density Icell - Cell Current Density keff - Effective Thermal Conductivity M - Molar Mass n - Electron Number nd - Electro-Osmotic Drag Coefficient P - Pressure R - Gas Constant Rm - Membrane Resistance Se - Source Term/Sink of Electrical Conservation Equation Sg - Source Term/Sink of Mass Conservation Equation Si - Source Term/Sink of Ionic Conservation Equation Sl - Source Term/Sink of Liquid Water Sm - Source Term/Sink of Momentum Conservation Equation Sphase - Source Term/Sink of Water in Corresponding Phase ST - Source Term/Sink of Energy Conservation Equation Sλ - Source Term/Sink of Dissolved Water T - Temperature eff xii V - Velocity Vcell - Cell Potential w - Mass Fraction Greek letters - Symmetry Factor - Transfer Coefficient - Porosity σ Electrical Conductivity - Overpotential - Viscosity ζ Stoichiometric Ratio Φi - Ionic Potential Φe - Electrical Potential λ - Membrane Water Content Subscripts act - Activation a - Anode c - Cathode conc. - Concentration resist - Resistance g - Gas Phase i - Specie cell - Fuel Cell Superscripts ref - Reference eff - Effective xiii LIST OF TABLES TABLE NO. TITLE PAGE 2.1 PEM fuel cell key feature modeling.................................................... 18 3.1 Governing equations in PEM fuel cell ................................................ 34 3.2 Source terms in PEM fuel cell ............................................................ 35 3.3 Constitutive relations in PEM fuel cell ............................................... 36 5.1 Calculated volume average values of the current density and osmotic dddddddddrag and back diffusion sources in cathode CL layer......................... 85 6.1 PEM fuel cell model experimental data (Ticianelli et al., 1988). ..... 101 xiv LIST OF FIGURES FIGURE NO. 1.1 1.2 3.1 3.2 TITLE PAGE Photovoltaic electrolyzer/fuel cell system ............................................ 2 PEM fuel cell schematic........................................................................ 4 Generic PEM fuel cell modeling framework ...................................... 30 SIMPLE algorithm in PEM fuel cell numerically implementation dddddddd(McNaughton et al., 2014).................................................................. 38 3.3 Dependence of the electrode current by Butler-Volmer equation on ddddddddoverpotential. ...................................................................................... 43 3.4 Comparison of Tafel and low-polarization approximations comparison ddddddddwith Butler–Volmer equation in specific case (Noren and Hoffman, dddddddd2005) ................................................................................................... 45 4.1 PEM fuel cell front view ..................................................................... 54 4.2 PEM fuel cell exploded view .............................................................. 54 4.3 Three dimentional view of discretized geometry................................ 55 4.4 Change in Polarization curve for three cases different in mesh size... 57 4.5 Comparison between experimental and modelling polarization curve dddddddddata...................................................................................................... 59 4.6 Three dimensional contours of current density magnitude. ................ 60 4.7 Longitudinal contours of current density magnitude. a) 0.4 V; b) 0.5 ddddddddV.......................................................................................................... 60 4.8 Three dimensional contours of hydrogen mole concentration. ........... 62 4.9 Longitudinal contours of hydrogen mole concentration. a) 0.4 V; b) dddddddd0.5 V.................................................................................................... 62 4.10 Three dimensional contours of oxygen mole concentration. ............... 63 4.11 Longitudinal contours of oxygen mole concentration. a) 0.4 V; b) 0.5 ddddddddV.......................................................................................................... 63 4.12 Three dimensional contours of water mole concentration. .................. 64 4.13 Longitudinal contours of water mole concentration. a) 0.4 V; b) 0.5 V. . 64 4.14 Longitudinal contours of heat ohmic source. a) 0.4 V; b) 0.5 V.......... 65 4.15 Longitudinal contours of activation overpotential. a) 0.4 V; b) 0.5 V. 66 4.16 Three dimensional contours of temperature......................................... 67 4.17 Longitudinal contours of temperature. a) 0.4 V; b) 0.5 V. .................. 68 xv 4.18 4.19 4.20 Longitudinal contours of water activity. a) 0.4 V; b) 0.5 V................. 69 Change in Polarization curve for three cases different in mesh size.... 70 Current density magnitude contours between the anode catalyst and dddddddmembrane at 0.35 V. a) mesh count 30k; b) mesh count 51k; c) mesh dddddddcount 137k............................................................................................. 72 4.21 Current density magnitude contours between the anode catalyst and dddddddmembrane at 0.75 V. a) mesh count 30k; b) mesh count 51k; c) mesh dddddddcount 137k............................................................................................. 72 4.22 Current density magnitude between the anode catalyst and membrane dddddddin transverse plane for different mesh count. a) 0.35 V; b) 0.75 V ...... 73 4.23 Change in Anode and cathode temperature in operating voltage range dddddddfor three cases different in grid size. a) Anode temperature, b) Cathode dddddddtemperature ........................................................................................... 75 4.24 Temperature contours between the anode catalyst and membrane at ddddddd0.35 V. a) mesh count 30k; b) mesh count 51k; c) mesh count 137k... 76 4.25 Temperature contours between the anode catalyst and membrane at ddddddd0.75 V. a) mesh count 30k; b) mesh count 51k; c) mesh count 137k... 76 4.26 Change in temperature between the anode catalyst and membrane in dddddddtransverse plane for different mesh count at 0.35 V ............................. 77 4.27 Change in Ohmic heat source in operating voltage range for three cases ddddddddifferent in mesh count. a) Anode Ohmic heat source, b) Cathode dddddddOhmic heat source ................................................................................ 78 4.28 Change in Reactants and production material concentration in dddddddoperating voltage range for three cases different in mesh count. a) dddddddHydrogen concentration, b) oxygen concentration, c) Water dddddddconcentration......................................................................................... 81 4.29 Hydrogen mass fraction contours between the anode catalyst and dddddddmembrane at 0.35 V. a) mesh count 30k; b) mesh count 51k; c) mesh dddddddcount 137k............................................................................................. 81 4.30 Hydrogen mass fraction contours between the anode catalyst and dddddddmembrane at 0.75 V. a) mesh count 30k; b) mesh count 51k; c) mesh dddddddcount 137k............................................................................................. 82 4.31 Hydrogen mass fraction between the anode catalyst and membrane in dddddddtransverse plane for different mesh count. a) 0.35 V; b) 0.75 V .......... 82 5.1 Water saturate distribution at the GDL and CL interface in cathode (a) dddddddv=0.7 V, =48 Sm-1 (b) v=0.1 V, =48 Sm-1 (c) v=0.7 V, =480 Sm1 ddddddd(d) v=0.1 V, =480 Sm-1 ................................................................... 86 5.2 Distribution of water saturation at GDL and CL interface in cathode for dddddddisotropic and anisotropic electrical conductivities (a) isotropic GDL (48 dddddddSm-1), (b) anisotropic GDL (through-plane=48 Sm-1 and in-plane=4000 dddddddSm-1), (c) isotropic GDL (480 Sm-1), (d) anisotropic GDL (throughdddddddplane=480 Sm-1 and in-plane=4000 Sm-1)............................................ 88 xvi 5.3 5.4 5.5 6.1 6.2 6.3 6.4 6.5 6.6 6.7 6.8 6.9 Water saturation distribution at GDL and CL interface in cathode for dddddddisotropic and anisotropic thermal conductivities (a) isotropic GDL ddddddd(k=1.7 W m-1 K-1), (b) anisotropic GDL(through-plane=1.7 W m-1 K-1 dddddddand in-plane=21 W m-1.K-1), (c) anisotropic GDL ( through-plane=1.7 dddddddW m-1 K-1 and in-plane=210 W m-1K-1). .............................................. 89 Temperature distribution contours at GDL and CL interface in cathode dddddddfor isotropic and anisotropic thermal conductivities (a) isotropic GDL ddddddd(k=1.7 W m-1 K-1), (b) anisotropic GDL(through-plane=1.7 W m-1 K-1 dddddddand in-plane=21 W m-1.K-1), (c) anisotropic GDL ( through-plane=1.7 dddddddW m-1 K-1 and in-plane=210 W m-1K-1). .......................................... 93 Water saturation distribution contours at GDL and CL interface in dddddddcathode (a) isotropic GDL with permeability=4.97*10-13 (m2), (b) dddddddanisotropic GDL with through-plane permeability=4.97*10-13 (m2) and dddddddin-plane permeability=1.87*10-12 (m2), (c) anisotropic GDL with dddddddthrough-plane permeability=4.97*10-12 (m2) and in-plane dddddddpermeability=1.87*10-12 (m2). .............................................................. 95 Comparison of Butler–Volmer equation and its new form in specific dddddddcase........................................................................................................ 98 Change in activation overpotential by changing the symmetry factor in ddddddda specific range ..................................................................................... 99 Polarization curves obtained from the model and the experiment data at ddddddddifferent pressures............................................................................... 102 Compassion between Butler-Volmer and K-J equation approximation dddddddwith different symmetry factor in high temperature; a) 1 , b) 4 ddddddd 1 , c) 1 , d) 3 .......................................................... 104 3 2 4 Compassion between Butler-Volmer and K-J equation approximation dddddddwith different symmetry factor in low temperature; a) 1 , b) 4 ddddddd 1 , c) 1 , d) 3 .......................................................... 107 3 2 4 R-squared value of K-J and Butler-Volmer equation comparison in dddddddwide range of symmetry factor ........................................................... 107 Standard deviation of K-J and Butler-Volmer equation compared in dddddddwide range of symmetry factor and temperature ................................ 108 The comparison between the K-J equation and other Butler-Volmer dddddddapproximation in in wide range of current density. ............................ 108 Logarithmic plot of activation loss against current density. a) Layout of dddddddthe exchange current density prediction, b) Example of the exchange dddddddcurrent density prediction. .................................................................. 111
