Graphing Quadratic Equations in Excel
advertisement

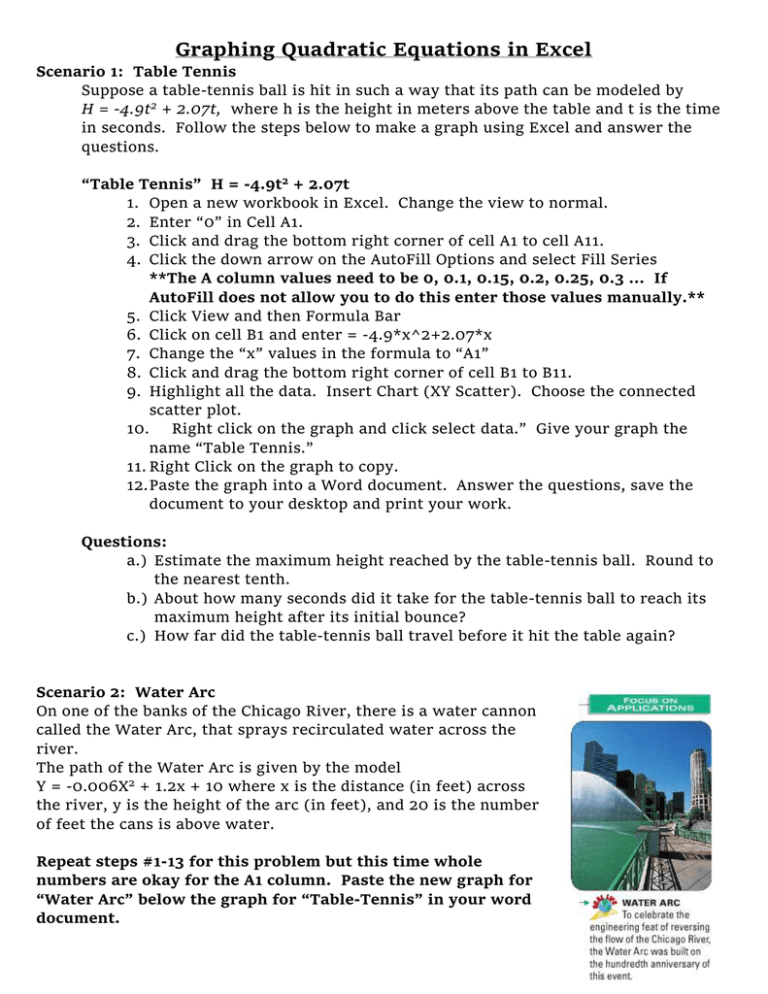
Graphing Quadratic Equations in Excel Scenario 1: Table Tennis Suppose a table-tennis ball is hit in such a way that its path can be modeled by H = -4.9t2 + 2.07t, where h is the height in meters above the table and t is the time in seconds. Follow the steps below to make a graph using Excel and answer the questions. “Table Tennis” H = -4.9t2 + 2.07t 1. Open a new workbook in Excel. Change the view to normal. 2. Enter “0” in Cell A1. 3. Click and drag the bottom right corner of cell A1 to cell A11. 4. Click the down arrow on the AutoFill Options and select Fill Series **The A column values need to be 0, 0.1, 0.15, 0.2, 0.25, 0.3 … If AutoFill does not allow you to do this enter those values manually.** 5. Click View and then Formula Bar 6. Click on cell B1 and enter = -4.9*x^2+2.07*x 7. Change the “x” values in the formula to “A1” 8. Click and drag the bottom right corner of cell B1 to B11. 9. Highlight all the data. Insert Chart (XY Scatter). Choose the connected scatter plot. 10. Right click on the graph and click select data.” Give your graph the name “Table Tennis.” 11. Right Click on the graph to copy. 12. Paste the graph into a Word document. Answer the questions, save the document to your desktop and print your work. Questions: a.) Estimate the maximum height reached by the table-tennis ball. Round to the nearest tenth. b.) About how many seconds did it take for the table-tennis ball to reach its maximum height after its initial bounce? c.) How far did the table-tennis ball travel before it hit the table again? Scenario 2: Water Arc On one of the banks of the Chicago River, there is a water cannon called the Water Arc, that sprays recirculated water across the river. The path of the Water Arc is given by the model Y = -0.006X2 + 1.2x + 10 where x is the distance (in feet) across the river, y is the height of the arc (in feet), and 20 is the number of feet the cans is above water. Repeat steps #1-13 for this problem but this time whole numbers are okay for the A1 column. Paste the new graph for “Water Arc” below the graph for “Table-Tennis” in your word document. Questions: a.What is the maximum height of the water sprayed from the Water Arc? b.How far across the river does the water land?


