14.48, Economics of Education Prof. Frank Levy Lecture 14
advertisement
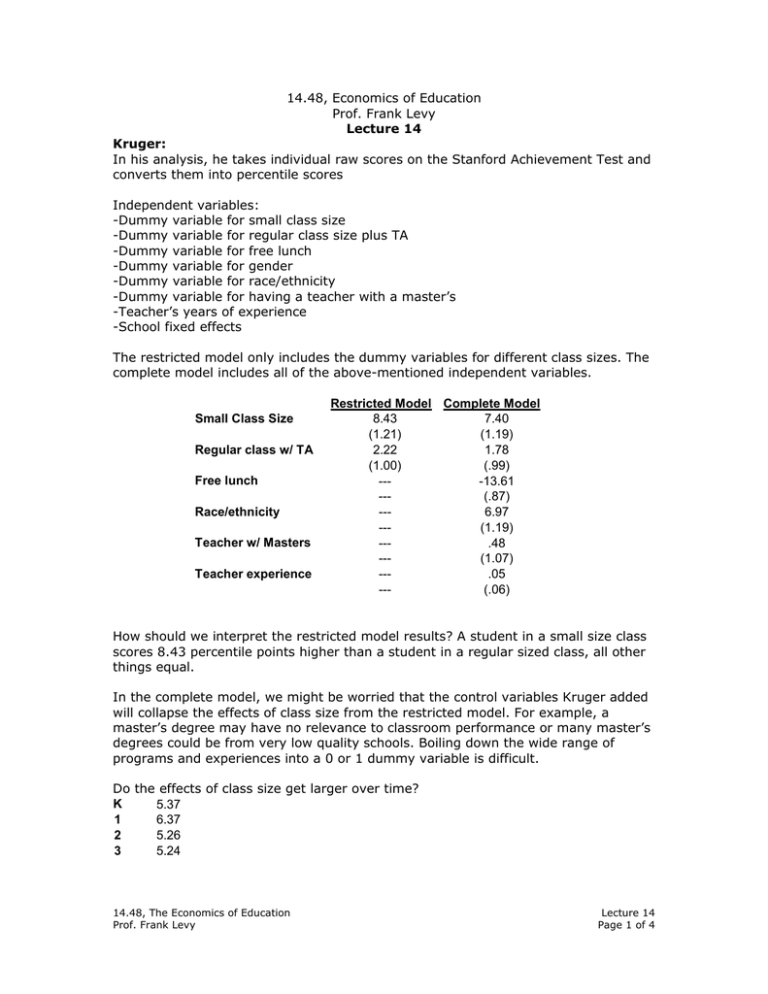
14.48, Economics of Education Prof. Frank Levy Lecture 14 Kruger: In his analysis, he takes individual raw scores on the Stanford Achievement Test and converts them into percentile scores Independent variables: -Dummy variable for small class size -Dummy variable for regular class size plus TA -Dummy variable for free lunch -Dummy variable for gender -Dummy variable for race/ethnicity -Dummy variable for having a teacher with a master’s -Teacher’s years of experience -School fixed effects The restricted model only includes the dummy variables for different class sizes. The complete model includes all of the above-mentioned independent variables. Small Class Size Regular class w/ TA Free lunch Race/ethnicity Teacher w/ Masters Teacher experience Restricted Model Complete Model 8.43 7.40 (1.21) (1.19) 2.22 1.78 (1.00) (.99) ---13.61 --(.87) --6.97 --(1.19) --.48 --(1.07) --.05 --(.06) How should we interpret the restricted model results? A student in a small size class scores 8.43 percentile points higher than a student in a regular sized class, all other things equal. In the complete model, we might be worried that the control variables Kruger added will collapse the effects of class size from the restricted model. For example, a master’s degree may have no relevance to classroom performance or many master’s degrees could be from very low quality schools. Boiling down the wide range of programs and experiences into a 0 or 1 dummy variable is difficult. Do the effects of class size get larger over time? K 5.37 1 6.37 2 5.26 3 5.24 14.48, The Economics of Education Prof. Frank Levy Lecture 14 Page 1 of 4 Are the same students tested each year? No. There is a lot of turnover in these classrooms so, each year, the group of students tested are new to the program/experiment. Using the whole sample: Was your initial class (K) a small class? (0,1) Was your initial class a regular class w/ TA? (0,1) Cumulative years in small class Cumulative years in regular class w/ TA 3.16 (.9) .49 (.67) 1.05 (.38) .25 (.37) If you’re first assignment is a small class, according to the results above, your percentile score increases by 3.16 percentile points. The Value Added Model: (TestScore ) June , 07 − (TestScore ) June , 06 = change in test score over a year Problems with applying the value added model? If the major benefits of small classes accrue after the first year of the program, then the benefit will be built into the test scores in subsequent years. How big is the overall effect? In the complete model, the effect of being in a small class is 7.4 percentile points. Is that a big magnitude? A small magnitude? How much money would you spend to get that effect? In other words, in order to interpret these results, you may want to run a cost-benefit analysis. Alternatively, you could compare the small class size effect from the complete model to the effects of other important control variables you are interested in such as race/ethnicity. The coefficient on race/ethnicity is 6.97, which is quite close to 7.40. Could small classes for minority students overcome the White/Asian and minority test gap? Well, we must first factor in the rest of our variables, especially the coefficient on the “free lunch” variable, which has an even larger magnitude. Average gain from being in a small class sized: .22 SD Basic Black/White test score gap: 1 SD How would you do a cost-benefit analysis? Money is not free. Neither is managerial and administrative time. ln(w) i = α + β 1 ( Ed ) i + β 2 ( Age) i + δ (TestScore) i + ε i See paper for Krugman’s full cost-benefit analysis. 14.48, The Economics of Education Prof. Frank Levy Lecture 14 Page 2 of 4 School Vouchers: This may be the most continuous issue that we will look at during this semester. Many people that study school vouchers approach their research with an already established viewpoint, so you need to be careful when evaluating research in this area. Theory: Public schools have not shown dramatic improvements over the last 25 years, on the whole, as measured by NAEP scores. How could you use an economic argument to explain this? There is a lack of competition in public school systems so schools are not forced to improve to compete for students. In the past, schools did not give parents good information about how well they were education students. Additionally, there were virtually no consequences for teachers or administrators in poorly performing schools. There are 2 ways to evaluate policy. 1) Natural experiments 2) Controlled/structured experiments With school choice, is it possible to have a natural experiment? In some cases, there can be competition among public school districts. Tiebout: He theorized that people make decisions about where to live based upon their own preferences and the tax, housing and public service bundles that various town offer. Say you have 2 geographic areas of the same size. One area is one large school district. The other area is split up into many school districts. If the theory is right, the geographic area with many school districts should have better performing schools because of competition. But how are school district lines drawn? They may be endogenous. Hoxby: Harvard economist who studied school choice using steams as an instrumental variable. Why? Because one of the chief reasons for relatively old school district boundaries was a stream. She argued that areas with more small and large streams resulted in more school districts that, in turn, resulted in somewhat higher student achievement. There is current debate over Hoxby’s method for classifying streams and whether or not her argument is accurate. In other words, we really need a structured experiment to evaluate school choice and school vouchers. What parameters do we have to lay out for a successful voucher program? 1) The amount of the voucher, including transportation 2) Who is eligible? 3) What schools can accept the voucher? 4) How many years can a student use the vouchers? 5) Application process 6) How do participating schools choose among voucher students? Does the voucher have to be accepted as full tuition? 14.48, The Economics of Education Prof. Frank Levy Lecture 14 Page 3 of 4 N students in public schools in a certain district M students apply for vouchers X students get vouchers Z students show up and use vouchers in the first year W students use vouchers for all 4 years N>M>X>Z>W Who is your treatment group? X Who is your control group? Students in M who didn’t get a voucher The treatment is whether or not the government gives a student a voucher, now whether or not a student actually uses the voucher. 14.48, The Economics of Education Prof. Frank Levy Lecture 14 Page 4 of 4
