7 . 1 5 S p r i... P a g e 1
advertisement
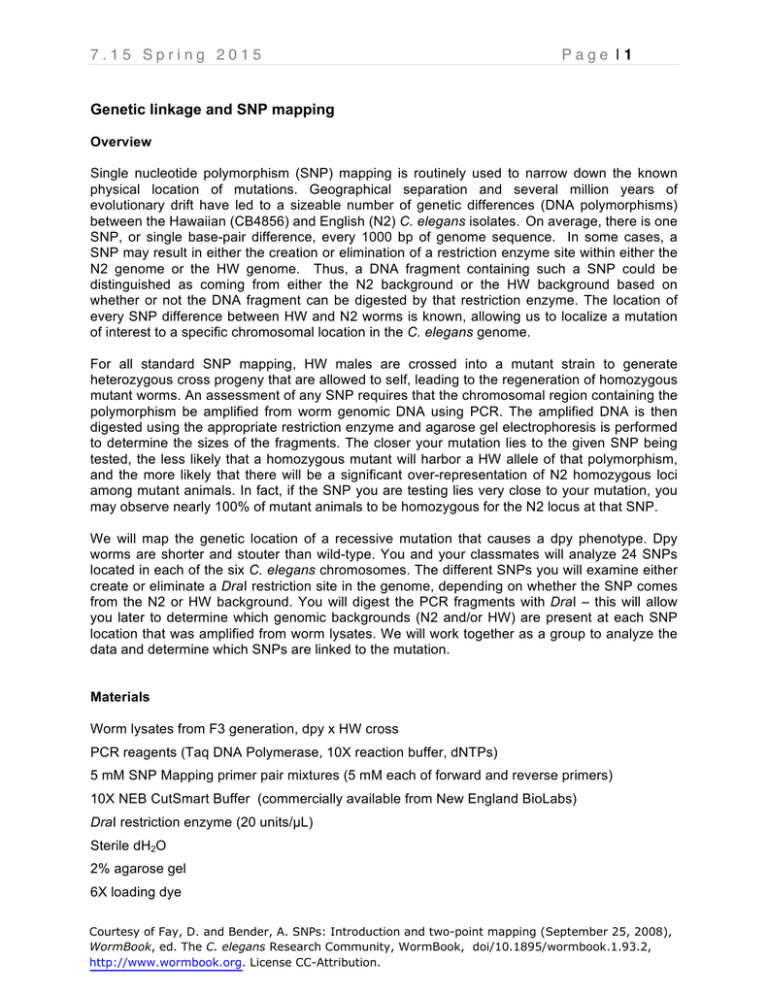
7.15 Spring 2015 Page |1 Genetic linkage and SNP mapping Overview Single nucleotide polymorphism (SNP) mapping is routinely used to narrow down the known physical location of mutations. Geographical separation and several million years of evolutionary drift have led to a sizeable number of genetic differences (DNA polymorphisms) between the Hawaiian (CB4856) and English (N2) C. elegans isolates. On average, there is one SNP, or single base-pair difference, every 1000 bp of genome sequence. In some cases, a SNP may result in either the creation or elimination of a restriction enzyme site within either the N2 genome or the HW genome. Thus, a DNA fragment containing such a SNP could be distinguished as coming from either the N2 background or the HW background based on whether or not the DNA fragment can be digested by that restriction enzyme. The location of every SNP difference between HW and N2 worms is known, allowing us to localize a mutation of interest to a specific chromosomal location in the C. elegans genome. For all standard SNP mapping, HW males are crossed into a mutant strain to generate heterozygous cross progeny that are allowed to self, leading to the regeneration of homozygous mutant worms. An assessment of any SNP requires that the chromosomal region containing the polymorphism be amplified from worm genomic DNA using PCR. The amplified DNA is then digested using the appropriate restriction enzyme and agarose gel electrophoresis is performed to determine the sizes of the fragments. The closer your mutation lies to the given SNP being tested, the less likely that a homozygous mutant will harbor a HW allele of that polymorphism, and the more likely that there will be a significant over-representation of N2 homozygous loci among mutant animals. In fact, if the SNP you are testing lies very close to your mutation, you may observe nearly 100% of mutant animals to be homozygous for the N2 locus at that SNP. We will map the genetic location of a recessive mutation that causes a dpy phenotype. Dpy worms are shorter and stouter than wild-type. You and your classmates will analyze 24 SNPs located in each of the six C. elegans chromosomes. The different SNPs you will examine either create or eliminate a DraI restriction site in the genome, depending on whether the SNP comes from the N2 or HW background. You will digest the PCR fragments with DraI – this will allow you later to determine which genomic backgrounds (N2 and/or HW) are present at each SNP location that was amplified from worm lysates. We will work together as a group to analyze the data and determine which SNPs are linked to the mutation. Materials Worm lysates from F3 generation, dpy x HW cross PCR reagents (Taq DNA Polymerase, 10X reaction buffer, dNTPs) 5 mM SNP Mapping primer pair mixtures (5 mM each of forward and reverse primers) 10X NEB CutSmart Buffer (commercially available from New England BioLabs) DraI restriction enzyme (20 units/µL) Sterile dH2O 2% agarose gel 6X loading dye &RXUWHV\RI)D\'DQG%HQGHU$613V,QWURGXFWLRQDQGWZRSRLQWPDSSLQJ6HSWHPEHU :RUP%RRNHG7KH&HOHJDQV5HVHDUFK&RPPXQLW\:RUP%RRNGRLZRUPERRN KWWSZZZZRUPERRNRUJ/LFHQVH&&$WWULEXWLRQ 7.15 Spring 2015 Page |2 Overview of SNP mapping (N2 background) HW (CB4856) If on the same chromosome: SNP-AN2 N2 (thin line) HW (thick line) SNP-AHW SNP-AHW SNP-AN2 SNP-AN2 SNP-AHW SNP-AHW SNP-AN2 ~25% ~50% ~25% If SNP-A is a HW-specific cutter: Figure 1. Overview of SNP mapping. In the case that your mutation is unlinked from the SNP being tested, homozygous mutants will segregate N2/N2: N2/HW : HW/HW animals in the standard 1:2:1 ratio. Thus 75% of the homozygous mutant animals will be either N2/HW (50%) or HW/HW (25%), whereas only 25% will be N2/N2. However, if the mutation is very close to the SNP being tested, near 100% of mutant animals will be homozygous for the N2 locus at that SNP. Adapted from doi/10.1895/wormbook.1.93.2, http://www.wormbook.org. Courtesy of Fay, D. and Bender, A. SNPs: Introduction and two-point mapping (September 25, 2008), WormBook, ed. The C. elegans Research Community, WormBook, doi/10.1895/wormbook.1.93.2, http://www.wormbook.org. License CC-Attribution. 7.15 Spring 2015 Page |3 Procedure A. PCR 1) Assemble the following reaction components for each 15 µL PCR reaction: Note: To minimize pipetting errors, it is recommended to create a master mix (dH20, Buffer, dNTPs, Taq) for the total number of samples and dispense the PCR reaction mixture into each tube. Then add the corresponding lysate and primers to each tube. Component dH2O 10X PCR Buffer 10 mM dNTPs 5 uM F/R Primer mix Worm Lysate Taq Polymerase For 15 µL reaction 10 µL 1.5 µL 0.3 µL 2 µL 1 µL 0.2 µL Final concentration 1X 200 µM .666 µM Variable 1U 2) Vortex the master mix briefly and centrifuge for 20 seconds. 3) Dispense 15 µL of the master mix into each 0.2 mL PCR tube. 4) Use the following thermocycling conditions for a routine PCR (500bp - 1kb amplicon): Step Initial Denaturation 35 cycles Final Extension Hold Temp. 95°C 95°C 60°C 68°C 68°C 4°C Time 2 minutes 15 seconds 30 seconds 1 minute 5 minutes 5) Run 5 µL of the PCR product in a 2% agarose gel before proceeding with digests to check if the PCR reaction was successful. (Please refer to the Agarose gel electrophoresis protocol for instruction on how to prepare and run gels). B. Digests 1) To digest the PCR product for SNP genotyping, combine the following reaction components. First, make a master mix containing the dH2O, 10X Buffer and Enzyme. Mix by vortexing, spin briefly and then add 5 µL of the master mix to 10 µL of the PCR product. Component dH2O 10X Buffer PCR product Restriction enzyme DraI For 15 µL reaction 3.2 µL 1.5 µL 10 µL 0.3 µL Final concentration 1X 6U &RXUWHV\RI)D\'DQG%HQGHU$613V,QWURGXFWLRQDQGWZRSRLQWPDSSLQJ6HSWHPEHU :RUP%RRNHG7KH&HOHJDQV5HVHDUFK&RPPXQLW\:RUP%RRNGRLZRUPERRN KWWSZZZZRUPERRNRUJ/LFHQVH&&$WWULEXWLRQ 7.15 Spring 2015 Page |4 2) Make sure that all the reaction components are well mixed and incubate the digest reaction 30 minutes at 37 °C. Alternatively, samples can be digested overnight at 37°C. C. Agarose gel electrophoresis Perform agarose gel electrophoresis to determine the sizes of the products of the DraI restriction enzyme digestion. Use a 2% agarose gel to get good resolution of the fragments. 1) Pipette 3 uL of 6X Loading Dye directly into each digest sample. Use a new tip for each tube to avoid cross-contamination. Mix all tubes by slowly pipetting up-and-down several times (avoid making bubbles). 2) Load the first lane of the 2 % agarose gel with 10 µL of the 100-bp DNA Ladder. 3) Load 15 µL of each of your DraI digest samples in the remaining lanes of the gel in the following order: Ladder A N2 A HW A Mut B N2 B HW B Mut C N2 C HW C Mut D N2 D HW D Mut 4) Run the gels at constant voltage (~130V) until the dye-front has run about two-thirds of the way along the gel (about 30-45 minutes). Take a photograph of your gel using the UV Transilluminator. D. Data analysis: determine restriction fragment sizes. 1) Using the 100-bp DNA Ladder (see ladder band sizes below), examine your agarose gel photograph and estimate the sizes of the restriction fragments present in each lane. 2) Compare the sizes of the restriction fragments you observed experimentally to the known expected sizes of the restriction fragments generated from N2 and HW SNP backgrounds as indicated in the attached table. (Note: it may be difficult to clearly visualize DNA fragments smaller than 100 bp). I Based on the sizes of your restriction fragments, determine if the SNPs are homozygous N2, homozygous HW or heterozygous (both N2-sized and HW-sized fragments are present in the same lane for heterozygous). Indicate in your table the genotypes for the SNPs you analyzed. 3) If both N2-sized and HW-sized fragments are present in the same lane, indicate in your notebook if there are significant differences in abundance of N2 and HW fragments relative to each other as observed on your gel. 4) Share your results with the other groups and collect their data for the other chromosomes to complete your table. 5) Based on the results, determine if any SNP are closely linked to your mutation (Note: the genetic background for a linked SNP will be N2). Use the information provided to assign the &RXUWHV\RI)D\'DQG%HQGHU$613V,QWURGXFWLRQDQGWZRSRLQWPDSSLQJ6HSWHPEHU :RUP%RRNHG7KH&HOHJDQV5HVHDUFK&RPPXQLW\:RUP%RRNGRLZRUPERRN KWWSZZZZRUPERRNRUJ/LFHQVH&&$WWULEXWLRQ 7.15 Spring 2015 Page |5 gene to one of the C. elegans chromosomes and to identify the general region of that chromosome to which the gene maps. Reference Fay, D. and Bender, A. SNPs: Introduction and two-point mapping (September 25, 2008), WormBook, ed. The C. elegans Research Community, WormBook, doi/10.1895/wormbook.1.93.2, http://www.wormbook.org. 100 bp ladder &RXUWHV\RI)D\'DQG%HQGHU$613V,QWURGXFWLRQDQGWZRSRLQWPDSSLQJ6HSWHPEHU :RUP%RRNHG7KH&HOHJDQV5HVHDUFK&RPPXQLW\:RUP%RRNGRLZRUPERRN KWWSZZZZRUPERRNRUJ/LFHQVH&&$WWULEXWLRQ 7.15 Spring 2015 Page |6 Scoring SNP mapping Primers Chromosome location Expected N2 Fragment Sizes (bp) Expected HW Fragment Sizes (bp) I, A 169,017 354, 146 500 I, B 2,818,973 395, 144 538 I, C 10,722,146 494 365, 129 I, D 12,729,812 236, 99, 78 335, 78 II, A 176,720 263, 112 375 II, B 3,828,599 516 387, 129 II, C 12,605,350 483 352, 132 II, D 13,235,564 500 368, 132 III, A 939,698 206, 189 395 III, B 2,599,699 368, 105 473 III, C 7,320,107 486 354, 132 III, D 11,656,188 339, 156 495 IV, A 1,799,032 187, 304 491 IV, B 3,347,952 295, 124 419 IV, C 4,991,851 376 300, 76 IV, D 16,085,085 241, 108, 78, 48 319, 108, 48 V, A 2,726,662 288, 167 455 V, B 4,550,757 454 307, 147 V, C 13,235,564 500 348, 152 V, D 17,610,508 282, 205 487 X, A 4,161,493 422, 72, 40 326, 96, 72, 40 X, B 10,637,922 409, 133 542 X, C 13,339,566 318, 191, 37 509, 37 X, D 15,500,013 358, 134 492 Mutant genotype (N2, HW or Het?) &RXUWHV\RI)D\'DQG%HQGHU$613V,QWURGXFWLRQDQGWZRSRLQWPDSSLQJ6HSWHPEHU :RUP%RRNHG7KH&HOHJDQV5HVHDUFK&RPPXQLW\:RUP%RRNGRLZRUPERRN KWWSZZZZRUPERRNRUJ/LFHQVH&&$WWULEXWLRQ MIT OpenCourseWare http://ocw.mit.edu 7.15 Experimental Molecular Genetics Spring 2015 For information about citing these materials or our Terms of Use, visit: http://ocw.mit.edu/terms.

