advertisement

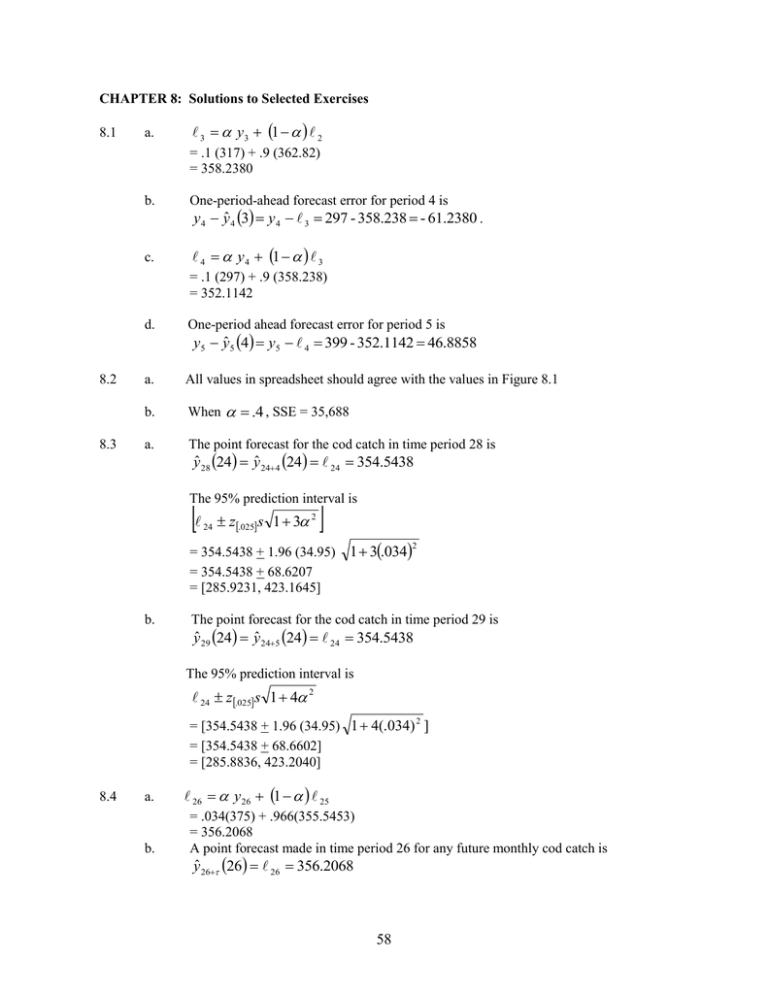
CHAPTER 8: Solutions to Selected Exercises 8.1 a. 3 y3 1 2 = .1 (317) + .9 (362.82) = 358.2380 b. One-period-ahead forecast error for period 4 is c. 4 y 4 1 3 y 4 yˆ 4 3 y 4 3 297 - 358.238 - 61.2380 . = .1 (297) + .9 (358.238) = 352.1142 8.2 8.3 d. One-period ahead forecast error for period 5 is a. All values in spreadsheet should agree with the values in Figure 8.1 b. When .4 , SSE = 35,688 a. The point forecast for the cod catch in time period 28 is y5 yˆ 5 4 y5 4 399 - 352.1142 46.8858 yˆ 28 24 yˆ 24 4 24 24 354.5438 The 95% prediction interval is 24 z.025 s 1 3 2 = 354.5438 + 1.96 (34.95) = 354.5438 + 68.6207 = [285.9231, 423.1645] b. 1 3.034 2 The point forecast for the cod catch in time period 29 is yˆ 29 24 yˆ 245 24 24 354.5438 The 95% prediction interval is 24 z.025 s 1 4 2 = [354.5438 + 1.96 (34.95) 1 4(.034) 2 ] = [354.5438 + 68.6602] = [285.8836, 423.2040] 8.4 a. b. 26 y 26 1 25 = .034(375) + .966(355.5453) = 356.2068 A point forecast made in time period 26 for any future monthly cod catch is yˆ 26 26 26 356.2068 58 95% prediction interval for March y 27 y 261 is 26 z .025 s = [356.2068 + 1.96(34.95)] = [356.2068 + 68.5020] = [287.7048, 424.7088] 95% prediction interval for April y 28 y 26 2 is 26 z.025 s 1 2 2 356.2068 1.9634.95 1 .034 356.2068 68.5416 287.6652,424.7484 95% prediction interval for May y 29 y 263 is 26 z.025s 1 2 2 2 356.2068 1.9634.95 1 2.034 356.2068 68.5811 287.6257,424.7879 8.5 a. 2 y2 1 1 b1 .2245 .8203.0051 .2933 211.1694 b2 2 1 1 b1 .1211.1694 203.0051 .9 .2933 .5525 (Slight round - off error. Excel carries values with more decimal places) b. c. yˆ 3 2 2 b2 21.1694 .5525 211.7219 y3 yˆ 3 2 185 211.7219 26.7219 3 y3 1 2 b2 .2(185) .8[211.1694 .5525] 206.3775 b3 3 2 1 b2 .1[206.3775 - 211.1694] .9(.5525) .0181 (Round - off error) 59 d. yˆ 4 3 3 b3 206.3775 .0181 206.3956 y4 yˆ 4 3 169 206.3956 37.3956 8.6 8.8 (Round - off error) a. Assuming 0 202.6246 and b0 .3682 (exactly 4 decimal place accuracy) all values in the spreadsheet should be same as values in Figure 8.6. b. SSE 46,387 when .1 and .1 e. Values in spreadsheet should be same as values in Part a. a. Point forecast for sales in week 56 yˆ 56 52 52 4b52 315.9460 4(4.5040) 333.962 95% prediction interval for sales in week 56 2 2 2 1+ 2 1 2 1 2 2 1 3 1 (.247) 2 (1 .095) 2 (.247) 2 (1 2.095) 2 (.247) 2 1 3.095 1.2603 2 [ yˆ 56 52 z .025 s 1 2 1 2 1 2 2 1 3 ] 2 2 2 [333.962 1.96(27.89) 1.2603 ] [333.962 61.37] [272.59, 395.33] b. Point forecast for sales in week 57 yˆ 57 52 52 5b52 315.9460 5(4.5040) 338.466 95% prediction interval for sales in week 57 1+ 2 1 2 1 2 2 1 3 2 (1 4 ) 2 2 1.2603 2 1 4 2 2 2 (From first part of Part a) 1.2603 (.247) 2 1 4.095 1.3765 2 [ yˆ 57 52 z .025 s 1 2 1 2 1 2 2 1 3 1 4 ] 2 2 [338.466 1.96(27.89) 1.3765 ] [338.466 64.13] [274.34, 402.60] 8.9 a. Revised point forecast for sales in week 56 when y53 300 yˆ 56 53 53 3b53 322.8089 3(4.7281) 336.9932 60 2 2 Revised 95% prediction interval for sales in week 56 when y53 300 1+ 2 1 2 (1 2 ) 2 2 1 .247 1 .095 .247 1 2.095 1.1595 2 2 2 2 [ yˆ 56 53 z .025 s 1 2 1 2 1 2 ] 2 2 [336.9932 1.96(27.89) 1.1595 ] [336.9932 58.86] [278.13, 395.85] Revised point forecast for sales in week 57 when y53 300 yˆ57 53 53 4b53 322.8089 4(4.7281) 341.7213 Revised 95% prediction interval for sales in week 57 when y53 300 1+ 2 1 2 (1 2 ) 2 2 1 3 2 2 1.1595 2 1 3 2 1.1595 (.247) 2 (1 3(.095)) 2 = 1.2602 (Should be same as 8.8a; round-off) [ yˆ 57 53 z .025 s 1 2 1 2 1 2 2 (1 3 ) 2 ] 2 2 [341.7213 1.96(27.89) 1.2602 ] [341.7213 61.37] [280.35, 403.09] b. Revised level and growth rate when y54 320 54 y54 1 [ 53 b53 ] .247(320) .753[322.8089 4.7281] 325.6754 b54 [ 54 53 ] (1 )b53 (.095)[325.6754 - 322.8089] .905(4.7281) 4.5512 c. Revised point forecast for sales in week 55 when y54 320 yˆ55 (54) 54 b54 325.6754 4.5512 330.2266 Revised 95% prediction interval for sales in week 55 when y54 320 61 [ yˆ 55 (54) z[.025] s ] [330.2266 (1.96)( 27.89)] [330.2266 54.66] [275.57, 384.89] Revised point forecast for sales in week 56 when y54 320 yˆ56 (54) 54 2b54 325.6754 2(4.5512) 334.7778 Revised 95% prediction interval for sales in week 56 when y54 320 2 yˆ56 54 z.025s 1 2 1 [344.7778 1.96(27.89) 1 (.247) 2 (1 .095) 2 ] [334.7778 56.63] [278.15, 391.41] Revised point forecast for sales in week 57 when y54 320 yˆ57 (54) 54 3b54 325.6754 3(4.5512) 339.329 Revised 95% prediction interval for sales in week 57 when y54 320 2 yˆ57 54 z.025s 1 2 1 2 (1 2 )2 [339.329 1.96(27.89) 1 (.247) 2 (1 .095) 2 (.247) 2 (1 2(0 .095)) 2 ] [339.329 58.86] [280.47, 398.19] 8.10 8.11 a. Using Excel, 0 204.8030 and b0 6.9406 c. .034, 0, SSE 24,750, s 33.54 a. Using the error correction form of the smoothing equations, 2 1 b1 [ y2 ( 1 b1 sn24 )] 1 b1 [ y 2 yˆ 2 (1)] 22.3079 1.0286 .2[1.1105] 23.5586 b2 b1 [ y 2 ( 1 b1 sn 24 )] b1 [ y 2 yˆ 2 (1)] 1.0286 (.2)(.1)[1 .1105] 1.0508 62 sn 2 sn 2 4 (1 ) [ y 2 ( 1 b1 sn 2 4 )] sn 2 (1 ) [ y 2 yˆ 2 (1)] 6.5529 (.8)(.1)[1 .1105] 6.6417 (Round - off error because spreadshee t carried more decimal places) b. yˆ 3 (2) 2 b2 sn34 2 b2 sn 1 23.5586 1.0508 18.5721 43.1815 One-period-ahead forecast error in period 3 is y3 yˆ 3 2 43 43.1815 0.1815 c. 3 2 b2 [ y3 ( 2 b2 sn34 )] 2 b2 [ y3 yˆ 3 (2)] 23.5586 1.0508 .2[-0.1815] 24.5731 b3 b3 [ y 3 ( 2 b2 sn3 4 )] b 3 [ y 3 yˆ 3 (2)] 1.0508 (.2)(.1)[- 0.1815] 1.0472 sn3 sn3 4 (1 ) [ y 3 ( 2 b2 sn3 4 )] sn 1 (1 ) [ y 3 yˆ 3 (2)] 18.5721 (.8)(.1)[0 .1815] 18.5576 d. (Round - off error) yˆ 4 (3) 3 b3 sn44 3 b3 sn0 24.5731 1.0472 (10.9088) 14.7115 One-period-ahead forecast error in period 4 is y4 yˆ 4 3 16 14.7115 1.2885 8.12 a. Assuming 4-decimal place accuracy for initial values, all values in your Excel spreadsheet should agree with those in Figure 8.9 b. All values in your optimization result should agree with the values in Figure 8.10. 63 8.14 a. yˆ 20 (16) 16 4b16 sn204 16 4b16 sn16 36.3426 4(.9809) (-10.9088) 29.3574 95% prediction interval for bike sales in period 20. c c 4 1 2 1 2 1 2 2 1 3 2 2 2 1 (.561) 2 (1 0) 2 (.561) 2 (1 20) 2 (.561) 2 (1 30) 2 1 3(.561) 2 1.9442 [ yˆ 20 (16) z[.025] s c4 ] [29.3574 1.96(1.2025) 1.9442 ] [29.3574 3.2863] [26.0711, 32.6437] b. yˆ 21 (16) 16 5b16 sn214 16 5b16 sn17 16 5b16 sn13 ( sn13 is last estimate for seasonal factor in quarter 1) 36.3426 5(.9809) - 14.2162 27.0309 95% prediction interval for bike sales in period 21 c c5 1 2 1 2 1 2 2 1 3 [ (1 4 ) (1 ) ] 2 2 2 c 4 [ (1 4 ) (1 ) ]2 1.9442 [.561(1 4(0) .439(0)] 2 2.2589 [ yˆ 21 (16) z[.025] s c5 ] [27.0309 1.96(1.2025) 2.2589 ] [27.0309 3.5423] [23.4886, 30.5732] 8.15 a. S 2 y2 / yˆ 2 116 / 100.1912 1.1578 S 6 y 6 / yˆ 6 123 / 110.0735 1.1174 S10 y10 / yˆ10 131 / 119.9559 1.0921 S14 y14 / yˆ14 140 / 129.8382 1.0783 64 2 S 2 S 6 S10 S14 4 1.1578 1.1174 1.0921 1.0783 4 1.1114 b. S 2 c. sn2 sn24 S2 (CF ) CF L S 1 S 2 S 3 S 4 4 .7062 1.1114 1.2937 .8886 1.0000 Hence, sn 2 =1.1114 (1) = 1.1114 d. S 3 y3 / yˆ 3 136 / 102.6618 1.3247 S 7 y 7 / yˆ 7 146 / 112.5441 1.2973 S11 y11 / yˆ11 158 / 122.4265 1.2906 S15 y15 / yˆ15 167 / 132.3088 1.2622 S 3 8.16 a. S 3 S 7 S11 S15 1.3247 1.2973 1.2906 1.266 1.2937 4 4 3 ( y3 / sn34 ) (1 )( 2 b2 ) ( y 3 / sn 1 ) (1 )( 2 b2 ) .2(136/1.29 37) .8(101.7726 2.6203) 104.5393 b3 ( 3 2 ) (1 )b2 .1(104.5393 - 101.7726) .9(2.6203) 2.6349 sn3 ( y 3 / 3 ) (1 ) sn3 4 ( y 3 / 3 ) (1 ) sn 1 .1(136/104. 5393) .9(1.2937) 1.2944 b. yˆ 4 (3) ( 3 b3 ) sn44 65 ( 3 b3 ) sn0 (104.5393 2.6349)(.8886) 95.2350 One-period-ahead forecast error in period 4 y4 yˆ 4 (3) 96 95.2350 .7650 c. 4 ( y 4 / sn44 ) (1 )( 3 b3 ) ( y 4 / sn 0 ) (1 )( 3 b3 ) .2(96 / .8886) .8(104.5393 2.6349) 107.3464 b4 4 3 1 b3 .1107.3464 - 104.5393 .92.6349 2.6521 sn 4 ( y 4 / 4 ) (1 ) sn 44 ( y 4 / 4 ) (1 ) sn0 .1(96/107.3 464) .9(.8886) .8892 d. yˆ 5 (4) ( 4 b4 ) sn54 ( 4 b4 ) sn1 (107.3464 2.6521)(.7086) 77.9449 One-period-ahead forecast error in time period 5 is y5 yˆ 5 (4) 77.9449 (Round-off error because spreadsheet carries more decimal places) 8.17 8.19 a. In order for the spreadsheet to match all values in Figure 8.22, the initial values should have exactly the same 4 decimal accuracy as given in this exercise. If the initial values are linked to the cells of a regression output, the initial values will be slightly different (even though not showing on spreadsheet with 4 decimal places) and all later values will be somewhat different. b. See comments in Part a. Results can be affected by initial values. a. yˆ 35 (32) ( 32 3b32 ) sn354 66 ( 32 3b32 ) sn31 [168.1213 3(2.3028)](1.2934) 226.3834 yˆ 36 (32) ( 32 4b32 ) sn364 ( 32 4b32 ) sn32 [168.1213 4(2.3028)](. 8908) 157.9678 b. 95% prediction interval for sports drink sales in time period 35 c c3 a 2 1 2 32 b32 a 2 1 32 2b32 32 3b32 2 2 2 .336 1 2.046 168.1213 2.3028 2 2 2 2 2 (.336) 2 1 .046 168.1213 22.3028 (168.1213 3(2.3028)) 2 3,910.0819 3,685.2069 30,635.3959 2 2 38,230.6847 [ yˆ 35 (32) z[.025] s r c3 ( sn31 )] [226.3834 1.96(.0193) 38,230.6847 (1.2934)] [226.3834 9.5665] [216.8169, 235.9499] 95% prediction interval for sports drink sales in time period 36. 2 2 c c4 2 1 3 32 b32 2 1 2 ( 32 2b32 ) 2 (1 ) 2 ( 32 3b32 ) ( 32 4b32 ) 2 (.336) 2 (1 3(.046) 2 )(168.1213 2.3028) 2 (.336) 2 (1 2(.046)) 2 (168.1213 2(2.3028)) 2 (.336) 2 (1 .046) 2 (168.1213 3(2.3028)) 2 (168.1213 4(2.3028)) 2 4,246.4410 4,016.4632 3,784.1245 31,446.8156 43,493.8443 [ yˆ 36 (32) z[.025] s r c4 (sn32 )] [157.9678 1.96(.0193) 43,493.8443 (.8908)] [157.9678 7.0276] [150.9402, 164.9954] 8.20 a. 33 ( y33 / sn29 ) (1 )( 32 b32 ) (.336)(124 / .7044) (.664)(168.1213 2.3028) 172.3098 67 b33 [ 33 32 ] 1 b32 .046[172.3098 - 168.1213] .954(2.3028) 2.3895 sn3 ( y 33 / 33 ) (1 ) sn 29 .134(124/172.3098) .866(.7044) .7064 b. Revised point forecast for sports drink sales in time period 34 when y33 124 yˆ 34 (33) ( 33 b33 ) sn30 (172.3098 2.3895)(1.1038) 192.8331 Revised 95% prediction interval for sports drink sales in time period 34 when y33 124 c c1 33 b33 172.3098 2.3895 30,519.8454 2 2 [ yˆ 34 (33) z[.025] s r c1 ( sn30 )] [192.8331 1.96(.0193) 30,519.8454 (1.1038)] [ 192.8331 7.2945] [185.5386, 200.1276] Revised point forecast for sports drink sales in time period 35 when y33 124 yˆ 35 (33) ( 33 2b33 )sn31 [172.3098 2(2.3895)](1.2934) 229.0467 Revised 95% prediction interval for sports drink sales in time period 35 when y33 124 c c 2 2 (1 ) 2 ( 33 b33 ) 2 ( 33 2b33 ) 2 (.336) 2 (1 .046) 2 (172.3098 2.3895) 2 (172.3098 2(2.3895)) 2 3,769.8516 31,360.4431 35,130.2947 [ yˆ 35 (33) z[.025] s r c 2 ( sn51 )] [229.0467 1.96(.0193) 35,130.2947 (1.2934)] [229.0467 9.1704] [219.8763, 238.2171] 68 Revised point forecast for sports drink sales in time period 36 when y33 124 yˆ 36 (33) ( 33 3b33 )sn32 [172.3098 3(2.3895)](. 8908) 159.8793 Revised 95% prediction interval for sports drink sales in time period 36 when y33 124 c c3 2 (1 2 ) 2 ( 33 b33 ) 2 2 (1 ) 2 ( 33 2b33 ) 2 ( 33 3b33 ) 2 (.336) 2 (1 2(.046)) 2 (172.3098 2.3895) 2 (.336) 2 (1 .046) 2 (172.3098 2(2.3895)) 2 (172.3098 3(2.3895)) 2 4,108.7164 3,873.6833 32,212.4602 40,194.8599 [ yˆ 36 (33) z[.025] s r c3 ( sn32 )] [159.8793 1.96(.0193) 40,194.8599 (.8908)] [159.8793 6.7558] [153.1235, 166.6351] 8.22 b. 0 310.9667 b0 13.6459 c. January February March April May June July August September October November December d. Assuming links to cells with initial value calculations (more than 4 decimal place accuracy), .700 8.23 a. sn11 .5137 sn10 .6123 sn 9 .6260 sn8 .7106 sn 7 .5980 sn 7 1.0055 sn 6 1.4850 sn5 1.6810 sn 4 1.9563 sn3 1.2613 sn 2 .9781 sn0 .5722 0 0 SSE 5249 Sr .0390 y 25 L24 25 354.5438 20 374.5438 69 L25 L24 25 354.5438 (.034)( 20) 355.2238 y26 L25 26 355.2238 (15) 340.2238 L26 L25 6 355.2238 (.034)( 15) 354.7138 y27 L26 27 354.7138 (5) 349.7138 b. y 25 L24 25 354.5438 (30) 324.5438 L25 L24 25 354.5438 (.034)( 30) 353.5238 y26 L25 26 353.5238 4 357.5238 L26 L25 26 353.5238 (.034)( 4) 353.6598 y27 L26 27 353.6598 22 375.6598 70


