Document 12913227
advertisement

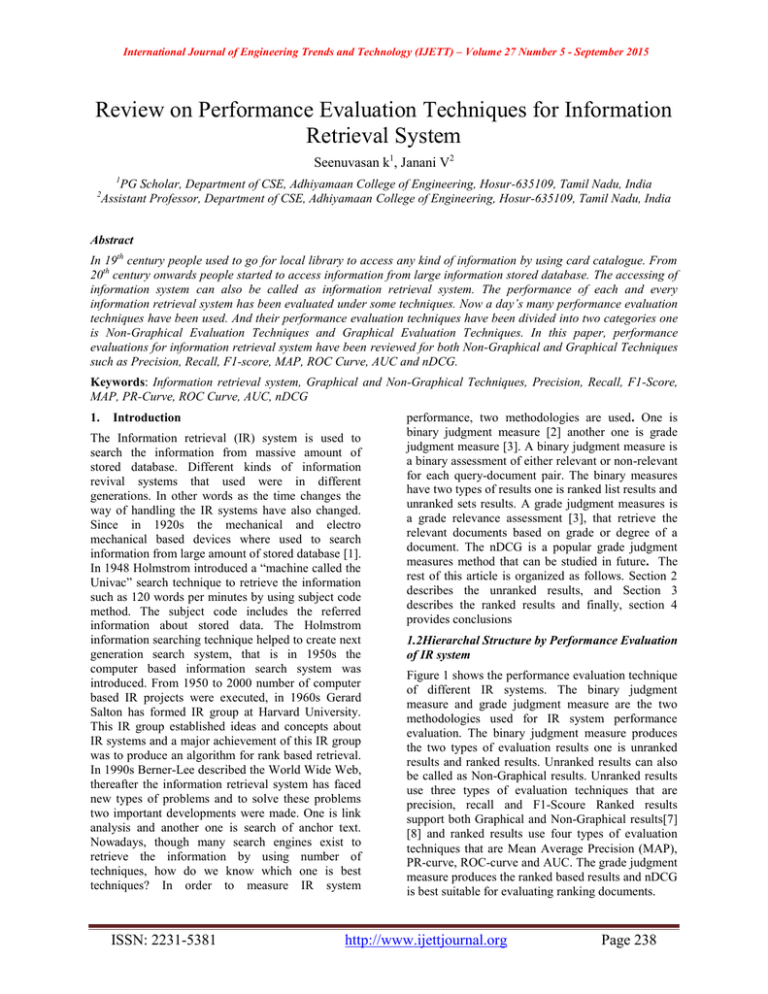
International Journal of Engineering Trends and Technology (IJETT) – Volume 27 Number 5 - September 2015 Review on Performance Evaluation Techniques for Information Retrieval System Seenuvasan k1, Janani V2 1 2 PG Scholar, Department of CSE, Adhiyamaan College of Engineering, Hosur-635109, Tamil Nadu, India Assistant Professor, Department of CSE, Adhiyamaan College of Engineering, Hosur-635109, Tamil Nadu, India Abstract In 19th century people used to go for local library to access any kind of information by using card catalogue. From 20th century onwards people started to access information from large information stored database. The accessing of information system can also be called as information retrieval system. The performance of each and every information retrieval system has been evaluated under some techniques. Now a day’s many performance evaluation techniques have been used. And their performance evaluation techniques have been divided into two categories one is Non-Graphical Evaluation Techniques and Graphical Evaluation Techniques. In this paper, performance evaluations for information retrieval system have been reviewed for both Non-Graphical and Graphical Techniques such as Precision, Recall, F1-score, MAP, ROC Curve, AUC and nDCG. Keywords: Information retrieval system, Graphical and Non-Graphical Techniques, Precision, Recall, F1-Score, MAP, PR-Curve, ROC Curve, AUC, nDCG 1. Introduction The Information retrieval (IR) system is used to search the information from massive amount of stored database. Different kinds of information revival systems that used were in different generations. In other words as the time changes the way of handling the IR systems have also changed. Since in 1920s the mechanical and electro mechanical based devices where used to search information from large amount of stored database [1]. In 1948 Holmstrom introduced a “machine called the Univac” search technique to retrieve the information such as 120 words per minutes by using subject code method. The subject code includes the referred information about stored data. The Holmstrom information searching technique helped to create next generation search system, that is in 1950s the computer based information search system was introduced. From 1950 to 2000 number of computer based IR projects were executed, in 1960s Gerard Salton has formed IR group at Harvard University. This IR group established ideas and concepts about IR systems and a major achievement of this IR group was to produce an algorithm for rank based retrieval. In 1990s Berner-Lee described the World Wide Web, thereafter the information retrieval system has faced new types of problems and to solve these problems two important developments were made. One is link analysis and another one is search of anchor text. Nowadays, though many search engines exist to retrieve the information by using number of techniques, how do we know which one is best techniques? In order to measure IR system ISSN: 2231-5381 performance, two methodologies are used. One is binary judgment measure [2] another one is grade judgment measure [3]. A binary judgment measure is a binary assessment of either relevant or non-relevant for each query-document pair. The binary measures have two types of results one is ranked list results and unranked sets results. A grade judgment measures is a grade relevance assessment [3], that retrieve the relevant documents based on grade or degree of a document. The nDCG is a popular grade judgment measures method that can be studied in future. The rest of this article is organized as follows. Section 2 describes the unranked results, and Section 3 describes the ranked results and finally, section 4 provides conclusions 1.2Hierarchal Structure by Performance Evaluation of IR system Figure 1 shows the performance evaluation technique of different IR systems. The binary judgment measure and grade judgment measure are the two methodologies used for IR system performance evaluation. The binary judgment measure produces the two types of evaluation results one is unranked results and ranked results. Unranked results can also be called as Non-Graphical results. Unranked results use three types of evaluation techniques that are precision, recall and F1-Scoure Ranked results support both Graphical and Non-Graphical results[7] [8] and ranked results use four types of evaluation techniques that are Mean Average Precision (MAP), PR-curve, ROC-curve and AUC. The grade judgment measure produces the ranked based results and nDCG is best suitable for evaluating ranking documents. http://www.ijettjournal.org Page 238 International Journal of Engineering Trends and Technology (IJETT) – Volume 27 Number 5 - September 2015 graphical results. The non graphical results are produced based on three techniques; Precision, Recall and F1-score. 2.Unranked Retrieval Results The Unranked retrieval result is defined as unordered documents that are measured to produce the non Figure 1: Performance Evaluation techniques (graphical and non graphical) hierarchal Structure 2.1 Precision, Recall and F1-score Precision is the fraction of retrieved documents that are relevant; recall is the fraction of relevant documents that are retrieved [4]. Precision and recall results is a binary assessment of either relevant (positive) or non-relevant (negative). relevant documents are retrieved; false negative means relevant documents are not retrieved. Precision and recall are inversely related, when precision is high (increase), recall falls (low); when recall is high (increase), precision falls (low).precision is more important for web search, recall is more important for patent search. F-measures or F1-score is derived from precision and recall measures. Both recall and precision combines in F1-score. The formula is given below, Where, TP-True Positive (relevant documents) TN-True Negative (not relevant documents) FN-False Negative (relevant documents) Where, FP-False Positive (not relevant documents) . Then default means 2.2 Example for precision, recall and F1-score Table 1: Example of Evaluation of precision, recall and F1-score Figure 2: Relationship between precision and recall True positive means relevant documents are retrieved; true negative means non relevant documents are not retrieved; false positive means non ISSN: 2231-5381 Evaluation Relevant Not Relevant Retrieved 20 40 Not Retrieved 60 100 http://www.ijettjournal.org = 0.33 Page 239 International Journal of Engineering Trends and Technology (IJETT) – Volume 27 Number 5 - September 2015 = 0.25 Table 3- Values of Precision and Recall = 0.28 Precision The total number of documents is 220; Table 1 is explained for relevant and not relevant, retrieved and not retrieved documents details. The precision is 0.33, recall is 0.25 and F1-Score is 0.28. Precision is calculated by fraction of retrieved documents that are relevant; recall is calculated by fraction of relevant documents that are retrieved. Based on non graphical evaluation methods precision, recall and F1-score are used to produce single scalar values (precision =0.33, recall =0.25 and F1-Score=0.28). 3. Ranked Retrieved Results The ranked retrieved result produce the graphical and non graphical results, this measurement slightly extended with unranked measurements and produce the high level results. Among these results precision and recall are rank based results, PR-Curve, ROCCurve, P-Precision, MAP (Mean Average Precision), AUC. 3.1 Precision and recall rank based results Rank based precision and recall are similar to unranked precision and recall, the rank based precision and recall measurement is extended from unranked measurements, these measurements are explained by the given example. Example 1: Table 2- Example Data Numbers of Documents Name of Documents Related Documents Recall 1.00 0.20 1.00 0.40 0.66 0.40 0.75 0.60 0.60 0.60 0.60 0.80 0.57 0.80 0.50 0.80 0.40 0.80 0.50 1.00 Above Table 2 contain 10 documents, there are 5 relevant documents marked as “X”. We retrieved one by one from top to bottom. The first document is retrieved, doc1 is relevant documents so precision is 100 % and recall is 20%. By retrieving the second document, doc123 is also relevant because it has the same precision value as 100% and recall value to 40% increases. By retrieving the Third documents, doc456 which is non relevant a precision value is decreased to 66% and recall value as no changes. When we retrieve the 5 relevant documents recall value has achieved 100% but when we measure the final achievement of precision is have only achieved 50% because 5 non relevant documents are retrieved. 1 doc1 2 doc123 3 doc456 4 doc45 5 doc78 6 doc567 Where, 7 doc1784 The integral of 0 to 1 precision is closely approximated. 8 doc444 9 doc1123 10 doc1789 ISSN: 2231-5381 3.1.1 Average Precision The average precision value is defined as the average values taken by the values of precision. And average precision produce the single value precision and recall results. Where, N is total number of documents, P (k) is the precision at a cutoff of k documents, ∆ r (k) is the http://www.ijettjournal.org Page 240 International Journal of Engineering Trends and Technology (IJETT) – Volume 27 Number 5 - September 2015 change in recall that happened between cutoff k-1 and cutoff k. From Table 2 and 3 the average precision has been calculated. Table 5- values of Precision and recall Precision Recall 1.00 0.20 = (1.00+1.00+0.75+0.60+0.50)/5 1.00 0.40 = 0.77 0.66 0.40 0.75 0.60 0.60 0.60 0.60 0.80 0.57 0.80 0.50 0.80 0.40 0.80 0.50 1.00 Average Precision Therefore the average precision value is 0.77. 3.2 Mean of Average Precision (MAP) MAP is rank based Non-Graphical evaluation technique that is used to produce the non-graphical results that are relevant to precision and recall. The average of the average precision value for a set of queries is called mean average precision. Average precision is calculated when the relevant document is retrieved. The given formula explains the above concept Where, n(Re) is the number of relevant documents, and take one or zero indicating non relevant or relevant at position k and i respectively. Example 2: Let‟s Consider Example 1 and 2. The average precision of Example 1 is Average precision = 0.77 Table 4- Example data Numbers of Documents Avg. precision = (1.0+0.28+0.30)/3=0.52 Name of Documents The average precision of Example 2 is Average precision = 0.52 Related Documents MAP= (0.77+0.52)/2=0.64 1 doc12 The Mean Average Precision for the example 1 & 2 has been calculated and the value is 0.64. 2 Doc423 3.3 Precision and Recall Curve 3 doc45 4 doc454 5 doc545 6 doc5 7 doc725 8 doc445 9 doc11 10 doc89 ISSN: 2231-5381 One of the good ways to characterize the performance of information retrieval systems is to produce the graphical way results by using the precision and recall curve [4]. The given precision and recall curve graph is based on Table 2 values. 3.4 ROC curve Roc (Receiver Operating Characteristics) is another rank based graphical performance evaluation technique and ROC graph is a technique for visualizing, organizing and selecting classifier based on their performance [5][6]. http://www.ijettjournal.org Page 241 International Journal of Engineering Trends and Technology (IJETT) – Volume 27 Number 5 - September 2015 1 Precisi… 0.8 Precision relevant documents or not retrieved non relevant documents. Negative - No, it is correct. TN –True Negative: 0.6 True - Retrieved relevant documents or not retrieved relevant documents or retrieved non relevant documents or not retrieved non relevant documents. 0.4 0.2 0 Negative - No, it is correct. 0 0.2 0.4 0.6 0.8 1 Metrics from the confusion matrix: Using above confusion matrix we have to defined sensitive and specificity followed by, Recall Figure 3: The precision and recall curve for our example, It has achieved 100% recall and 50% precision ROC curve are described by two terms, one is sensitivity and specificity. Sensitivity is also called as recall, which is defined as how many relevant documents have been retrieved as being relevant document. Specificity is how many of the not relevant document have been retrieved as being non relevant. The following confusion matrix as explained the working principle about ROC curve. 3.4.1 Confusion Matrix Total prediction TP + FP = TPP, FN + TN = TPN Total ground truth TP + FN = TAP, FP+TN = TAN True Positive Rate (recall) TP rate = False Positive Rate (false alarm) FP rate = ROC curve confusion matrix: Sensitivity = = Specificity = = 3.4.2 ROC Space Where, TP –True Positive: True - Retrieved relevant documents or not retrieved relevant documents or retrieved non relevant documents or not retrieved non relevant documents. Positive - Yes, it is correct. FP –False Positive: False - Retrieved relevant documents or not retrieved relevant documents or retrieved non relevant documents or not retrieved non relevant documents. Positive - Yes, it is correct. FN –False Negative: False - Retrieved relevant documents or not retrieved relevant documents or retrieved non ISSN: 2231-5381 Each and every classification problem uses only two classes, one is positive class another one is negative class, each instance I mapped to positive „p‟ or negative „n‟ class labels. The discrete classifier model produces the single ROC point. Some classification models such as a neural network or Naive Bayes produce a continuous output. The discrete classifier model will be discussed here and remaining classification model will be discussed in next section. ROC graphs are two dimensional graphs, the (TP, FP) pairs are represented as discrete classifier. TP rate is plotted on Y axis and FP rate is plotted on X axis [5]. Let‟s consider 100 positive and 100 negative instances that have been defined in confusion matrix. A, B, C ROC points are represented as discrete classifier. Figure 4 shows as all discrete classifiers. The left lowers point (0, 0) represent as no false positive error and also no true positives. The right upper point (1, 1) represents opposite strategies of (0, 0). http://www.ijettjournal.org Page 242 International Journal of Engineering Trends and Technology (IJETT) – Volume 27 Number 5 - September 2015 number of negative instance, so performance in the far left-hand side of the ROC graph become more interesting[6]. ‘A’ -Discrete classifier ROC point TP=63 FP=28 91 FN=37 TN=72 109 100 100 200 3.4.3 Create Curves in ROC Space TP rate = = = 0.63 FP rate = = = 0.28 The discrete classifier represents only single point in ROC space. Some classifiers (neural network or Naive Bayes) naturally yield an instance probability or score [6]; the scoring classifier can be used with thresholds procedure. Each threshold values produce the different ROC space points. Table-6 Example Data for ROC ‘B’ -Discrete classifier ROC point TP=76 FP=12 88 FN=24 TN=88 112 100 100 200 TP rate = = = 0.76 FP rate = = = 0.12 Instance Class Score TP FP 1 p 0.03 0.14 0.00 2 p 0.08 0.28 0.00 3 n 0.10 0.28 0.09 4 p 0.11 0.42 0.09 5 n 0.22 0.43 0.18 6 p 0.32 0.57 0.18 7 p 0.35 0.71 0.18 8 n 0.42 0.71 0.27 9 n 0.44 0.71 0.36 10 p 0.48 0.85 0.36 11 n 0.56 0.85 0.45 12 n 0.65 0.85 0.54 13 n 0.71 0.85 0.63 14 n 0.72 0.85 0.72 15 p 0.73 1.00 0.72 16 n 0.80 1.00 0.81 17 n 0.82 1.00 0.90 18 n 0.99 1.00 1.00 ‘C’ -Discrete classifier ROC point TP=24 FP=88 112 FN=76 TN=12 88 100 100 200 TP rate = = = 0.24 FP rate = = = 0.88 True Positive 1 B 0.8 A 0.6 0.4 0.2 C 0 0 0.2 0.4 0.6 0.8 1 False Positive Figure 4: A basic ROC Space (graph) showing three discrete classifiers. The left upper point (0, 1) represents perfect classification. The „B‟ ROC point is perfect performance. The right lower point (1, 0) represents unperfected classification or low level performances, „C‟ ROC point is unperfected or low performance. The most real world domains are dominated by large ISSN: 2231-5381 Figure 5 illustrates the ROC curve of an example test set of 18 instances, 7 positive instances and 11 negatives instances that are shown in Table 6 and the instances are shorted by ascending order. The ROC points at (0.1, 0.7) produces its highest accuracy. http://www.ijettjournal.org Page 243 International Journal of Engineering Trends and Technology (IJETT) – Volume 27 Number 5 - September 2015 [7] E. Rasmussen, "Evaluation in Information Retrieval," in 3rd International Conference on Music Information Retrieval, Paris, France, 2002, pp. 45-49. [8] K. Zuva and T. Zuva, "Evaluation of Information Retrieval Systems, " International Journal of Computer Science & Information Technology (IJCSIT), vol. 4, pp. 35-43, 2012. 1 True Positive 0.8 Method 0.6 0.4 0.2 0 0 0.2 0.4 0.6 0.8 1 False Positive Figure 5: Example of ROC 3.5 AUC AUC (Area under an ROC curve) is used to measure the classification models quality. The area of the unit square is called portion of the AUC, its value of AUC will always be between 0 and 1.0. The higher AUC value is between 0.5 and 1.0, and this value is better quality for classification model. 4. Conclusion We have presented a various type of evaluation techniques for information retrieval system. And have presented a complete binary judgment measures techniques such as Graphical and Non-Graphical techniques. The Non-Graphical techniques (Precision, Recall, F1-Score, MAP) produces the single scalar values. The graphical evaluation techniques (PR-Curve, ROC Curve, AUC and nDCG) are used to visualize the IR system performance for easy user view. In future work, review on complete grade judgment measures and techniques will be discussed. References [1] Mark sanderson and W.BruceCroft , "The history of information retrieval research", in proc. of IEEE conference, may 2012. [2] Kevin P. Murphy. Performance evaluation of binary classifiers. Technical Report, University of British Columbia, 2007 [3] Jaana Kekäläinen , Kalervo Järvelin, Using graded relevance assessments in IR evaluation, Journal of the American Society for Information Science and Technology, v.53 n.13, p.1120-1129, November 2002 [4] J. Davis and M. Goadrich "The Relationship between Precision-Recall and ROC Curves", Proc. Int?l Conf. Machine Learning, pp.233 -240 [5] T. Fawcett "An Introduction to ROC Analysis", Pattern Recognition Letters, vol. 27, no. 8, pp.861 -874 2006 [6] T. Fawcett "ROC Graphs: Notes and Practical Considerations for Data Mining Researchers", 2003 :HP Labs ISSN: 2231-5381 http://www.ijettjournal.org Page 244


