The Potential of Synthetic Aperture Sonar in seafloor imaging
advertisement
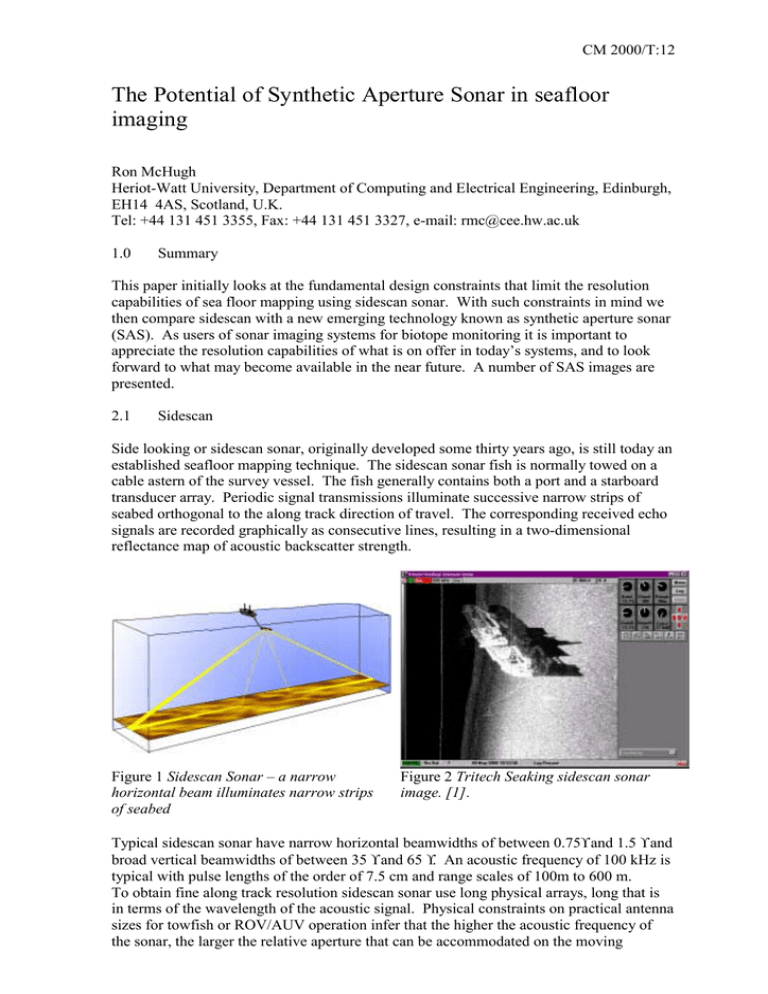
CM 2000/T:12 The Potential of Synthetic Aperture Sonar in seafloor imaging Ron McHugh Heriot-Watt University, Department of Computing and Electrical Engineering, Edinburgh, EH14 4AS, Scotland, U.K. Tel: +44 131 451 3355, Fax: +44 131 451 3327, e-mail: rmc@cee.hw.ac.uk 1.0 Summary This paper initially looks at the fundamental design constraints that limit the resolution capabilities of sea floor mapping using sidescan sonar. With such constraints in mind we then compare sidescan with a new emerging technology known as synthetic aperture sonar (SAS). As users of sonar imaging systems for biotope monitoring it is important to appreciate the resolution capabilities of what is on offer in today’s systems, and to look forward to what may become available in the near future. A number of SAS images are presented. 2.1 Sidescan Side looking or sidescan sonar, originally developed some thirty years ago, is still today an established seafloor mapping technique. The sidescan sonar fish is normally towed on a cable astern of the survey vessel. The fish generally contains both a port and a starboard transducer array. Periodic signal transmissions illuminate successive narrow strips of seabed orthogonal to the along track direction of travel. The corresponding received echo signals are recorded graphically as consecutive lines, resulting in a two-dimensional reflectance map of acoustic backscatter strength. Figure 1 Sidescan Sonar – a narrow horizontal beam illuminates narrow strips of seabed Figure 2 Tritech Seaking sidescan sonar image. [1]. Typical sidescan sonar have narrow horizontal beamwidths of between 0.75° and 1.5 ° and broad vertical beamwidths of between 35 ° and 65 °. An acoustic frequency of 100 kHz is typical with pulse lengths of the order of 7.5 cm and range scales of 100m to 600 m. To obtain fine along track resolution sidescan sonar use long physical arrays, long that is in terms of the wavelength of the acoustic signal. Physical constraints on practical antenna sizes for towfish or ROV/AUV operation infer that the higher the acoustic frequency of the sonar, the larger the relative aperture that can be accommodated on the moving platform, and hence the better the along track resolution. High frequency operation however also infers relatively short-range operation, due to the increasing absorption of sound in water with frequency. Range or across track resolution is related to acoustic pulse length. Long transmit pulse duration’s are used in order to ensure good Signal to Noise ratios. With improvements in acoustic sensor technology wide bandwidth transmitted signatures (chirps) are now common. Used with pulse compression techniques range resolution has been significantly improved in the last few years. It is with the azimuth resolution of sidescan however that we come to the critical limits for sidescan technology. In the next section we look at the basic design constraints for sidescan along track resolution. 2.2 Sidescan azimuth resolution There are two key design equations that specify the limits for sidescan sonar along track resolution. In both equations it is the physical size, L, of the receiving or/and transmitting aperture that is crucial. In particular we are interested in the relationship between this physical aperture size and the acoustic wavelength. Equation 1: Angular Resolution of the aperture, θH is defined in terms of the half power, or 3dB beamwidth, of the antenna aperture. This can be approximated as the reciprocal of the number of wavelengths, λ, apparent across the effective aperture L as λ θH = k . L where k is a scaling factor that represents the aperture shading (k = 0.88 for a rectangular aperture). Equation 2: The Near/Far field limit, or NF, is approximated to L2/λ. All conventional sidescan sonar systems should operate in their far-field; in conditions where the acoustic wavefront arriving at the array aperture can be considered a plane wave. This restriction dictates the closest range that a conventional sidescan sonar can effectively image. Consider the following examples. Example 1: Consider a 400 kHz sidescan sonar with a 0.5 degree horizontal beamwidth. Let the maximum swath coverage be 300m. For 400 kHz operation and 1500ms-1 speed of sound in water the wavelength (λ) is 3.75 mm. For the 0.5 degree beamwidth the array length, L, will be of the order of 38 cm. In terms of wavelength the 0.5 degree beamwidth requires ~ 100 λ aperture. The NF condition and hence near range limit will be of the order of 38 m. Now the azimuth (or along track) resolution for an aperture in the far field is directly proportional to range. At a particular slant range R the spatial resolution (ρ) is given by: Rλ ρ =k . L At the NF limit range of 38m this 400 kHz sonar would have an azimuth resolution of ~33 cm. In comparison, at the maximum range of 300m the azimuth resolution becomes 2.6m. This is a considerable degradation in resolution with increasing range. It would appear as if one solution would be to reduce the effective beamwidth by increasing the aperture size. 2 Example 2: Consider doubling the aperture size of the above example to 2L to create a 0.25 degree beamwidth. The NF will scale by a factor of four to become 154 m. At this range the azimuth resolution is 67 cm. At 300 m range the azimuth resolution becomes 1.3 m. So doubling the aperture size improves the far range resolution. Close to the transducer however the resolution is worse, due to the increased aperture size. The NF limit is also significantly increases. A final consideration for sidescan sonar is tow speed. The scene should be insonified at along track intervals equivalent to the minimum swath resolution. To avoid having multiple pulses in the water the pulse repetition frequency is dictated by the time of flight for twice maximum swath. The longer the range, the slower the tow speed. For the 0.5 degree system example we would send an acoustic pulse into the water every 0.4s and in that time move 0.33m. This is equivalent to a tow speed of 0.825 ms-1 or 1.5 knot. The 0.25 degree system example would double the tow speed to 3.1 knots. 2.3 Sidescan: the verdict Sidescan, as with all sonar, is a resolution-limited tool. For example, if we have a 1 cm diameter steel ball “target” suspended vertically upright from the sea floor, when viewed by our 0.5 degree sidescan at a 40 m range it will have a along track resolution of ~ 0.33m. At 300 m range the small ball has an effective along track resolution of 2.6 m. The move to applying beamforming techniques to sidescan can significantly improve sidescan performance. Sidescan arrays normally combine all the individual transmit and receive elements together to create one large aperture. Separating these elements into clusters and employing beamforming is a superior technology, which enhances resolution. Such systems can offer at least a two-fold improvement in along track resolution, with the added bonus of an improved tow speed [2]. 3.0 The alternative way forward: Synthetic Aperture Sonar (SAS) Synthetic Aperture (SA) techniques are by no means new. Synthetic Aperture Radar (SAR) is well established in both airborne and spaceborne applications [3]. What makes SA techniques so interesting is that by processing successive background signals from a moving antenna they offer the potential for high-resolution range independent along track resolution. Synthetic Aperture Sonar has been proposed as an eventual replacement for sidescan however, to date, other than for a few military programmes dedicated to mainly minehunting applications, there are no commercial systems available. The move of SA concepts from an em-propagation application to an acoustic sound-propagation-in-water application is not as easy a move as one would at first suspect. The sound speed in water is approximately 1500ms-1, em waves travel at 3x10⁸ ms-1. The scaling factor is such that it introduces a whole new range of technology challenges. However range independent imaging (no RθH problems) is a very desirable commodity. 3.1 How does SAS work? We saw in section 2.2, that azimuth resolution is a function of the size of the physical aperture (in terms of wavelengths) used by the sonar. In synthetic aperture operation a very large aperture can be created through the use of a small physical aperture (of only a few individual elements) moving over a linear trajectory. Figure 3 (a) illustrates the basic concept of SA imaging. The moving platform carries an antenna of length L over a particular track some distance h above the terrain surface. The antenna is considered as both a transmitter and a receiver oriented sideways to the 3 direction of travel and at a particular slant angle. Regular successive pulse transmissions are made as the physical aperture traverses the track, illuminating the area of terrain bounded by the antenna beam. Scatterers within the beam reflect the pulse energy, a proportion of which will be received back at the antenna after a time delay. The time delay at each transmission position is representative of the scatterers range, relative to the antenna. θ (a) (b) Figure 3 Synthetic Aperture imaging geometry. (a) shows a conceptual sidelooking SA configuration and (b) a plan view illustrating the range variant SA lengths. Consider the sea floor as composed of “cells” of physical dimension equivalent to the fundamental system imaging resolution. Think of these cells as the individual pixels you see on your display screen. The antenna vertical beamwidth defines the illuminated swath, while the horizontal beamwidth defines the time period which a particular scatterer is illuminated. The horizontal beamwidth will increase with range and will define the length of the SA (Lsa) that can be formed for a particular scatterer at a particular range. See Figure 3(b). From a geometric point of view, consider the “cells” on the sea floor as individual points in your image. Using conventional sonar beamforming techniques we would use a central transmitter to insonify the scene and “focus” these points (beamform) by using a priori knowledge of time of flight “calculations” from each point to each receive element. Figure 4a illustrates this concept. To focus at points P1 or P2 acoustic energy reflected from each point will sum coherently if we map the “delays” as shown on the space-time memory of the sonar. With SAS the delay path for coherent summation for each point is a two-way-path; from transmit element - to the imaging point - back to the receive element. The path has “double phase sensitivity” but otherwise the SA imaging concept can be considered as identical to that for normal beamforming. In SAS processing we effectively map every pixel point on the sea floors “rectangular grid” to the desired “delays”. As the sonar moves along the track, each point in the image is coherently summed for as long as it remains within the insonifying beam. 4 λ/2 (a) (b) Figure 4 Comparison of conventional sonar array beamforming/imaging and SAS for two individual point targets 3.2 So what is the along track resolution for SAS? Consider a physical aperture of length L traversing a perfectly linear track. The SA length and the platform velocity define the length of time that a stationary scatterer, at range R, lies within the physical aperture beam. The length of the SA will equate to the width of the physical aperture beam (or its resolution ρ pa) at range R or, λ Lsa = ρ pa ≈ R L The phase of the received echo signal changes due to the differences in range to and from the scatterer at the each transmission position. The SA along track spatial resolution ρsa can be expressed as λ ρ sa = R 2 Lsa where the factor of 2 comes from the double phase sensitivity. Lsa relates the SA azimuth resolution to the characteristics of the physical aperture as Rλ L L ρ sa = ⋅ = 2 Rλ 2 This expression implies that the SA azimuth resolution for side looking SA is independent of range and also independent of frequency. In theory, only the physical aperture size (L) matters. To put this in context, if we used an array consisting of four λ/2 elements at a frequency of 400 kHz then L/2 equates to a range independent azimuth resolution of 7.5 mm. 3.3 SA Images Figure 5 shows three images created in a test tank environment using a 100kHz SA sonar demonstration system based at Heriot-Watt University. The target was a 0.4m square angle-iron frame with a 4cm cross section lying on a gravel bed. The 1.5m square image was sampled at 128 points in range and azimuth providing an image cell dimension of 1.2cm in both range and azimuth. The target range is only a few metres. 5 Image Figure 5c shows what would be seen by a “typical” forward-look sonar. Figure 5a shows a SAS system that is considered narrowband; that is it transmits a long 100 kHz cw acoustic transmit signature, giving relatively poor range resolution. Figure 5b is a wideband SAS configuration using a chirp transmit signature. The image created from the chirp pulse in (b) gives better range resolution due to pulse compression. (a) (c) (b) Figure 5 Sonar images of a 0.4m square angle-iron framework lying on a gravel bottom. (a) a narrowband, 0.3 ms pulse width, SA image. (b) a wideband 80 kHz bandwidth, 0.3ms chirp pulse width, SA image. (c) shows a forward-looking image from a 16 element 100 kHz linear array beamformer using focused beamforming. Figure 6 shows two SAS images (thanks to Raytheon, [4]) made of a resolution target at a range of 660 m. The target consists of three 20-cm diameter air filled metal spheres mounted on a steel rod. The target was located on the bottom of Lake Washington, USA. This towed SAS system operates at 50 kHz and has a 20-cm receive array consisting of a line of 16 elements. The left image was composed of 10 pings on the target which produces an azimuth resolution at 660m of about 68 cm. The image shows the three balls as one object with grating lobes. The right hand image used 68 pings and the resolution is improved to 10 cm. The three balls can be clearly seen. Figure 6 SAS images from a 50 kHz sonar of three 20 cm ball targets viewed at a range of 660 m 6 345 350 355 Ra nge (m) 360 365 370 360 365 370 375 380 385 390 395 400 405 Azimuth (m) Figure 7 SAS image of a sunken aircraft from a range of 350 m. The image shows details of the planes internal structure resolved to approximately 15 cm. Figure 7 shows a SAS image of a sunken US navy patrol aircraft resting in 50m of water (thanks to Dynamics Technology [5]). The thin aluminium skin of this aircraft is nearly transparent to this 50 kHz sonar. 3.4 SAS: the technical challenges In Synthetic Aperture Sonar the coherence essential for the creation of an acoustic SAS image can be compromised by a number of factors. These include the effects of temporal variations in the sound channel as well as the effect of aberrations in platform trajectory. A sway variations of only 0.25λ can cause severe degradation in image quality. Note, at 400 kHz a quarter wavelength is only ~ 1 mm. There are many technical challenges to be addressed. 4.0 Summary Range independent resolutions of the order of a cm are possible with SAS technology. Given that the technical problems can be solved (or overcome by clever design) the possibilities for sea floor imaging are very exciting indeed. This is a sonar technology that needs to be developed for marine biology applications. References [1] [2] [3] [4] [5] Thanks to Systems Technologies, Ulverston, U.K., for the use of Figure 2. Klein 5000 multibeam sidescan (www.kleinsonar.com/imgal.html) Wiley, C.A. ‘Synthetic Aperture Radars’, IEEE Trans. Aerosp. Electron. Sys., 1985, AES-21, pp 440-443 Thanks to Raytheon Sytems and Dynamics Technology Inc. for the use of Figure 6. From Garrood, D., Lehtomaki N., Luk T., Neudorfer M., Palowitch A. ‘Synthetic Aperture Sonar: an evolving technology’, Sea Technology, June 1999. Thanks to Ralph Chatham of Dynamics Technology, Inc. California and asociates for the use of Figure 7. From Marx, D., Nelson M., Chang E., Gillespie W., Putney A., Warman K. ‘An introduction to Synthetic Aperture Sonar’, IEEE Workshop on Statistical and Array Processing (SSAP-2000), August 2000. This work was sponsored by the U.S. Defence Advanced Research Projects Agency. Hardware was build by Raytheon; data processing carried out by Dynamics Technology Inc. 7
